This site uses cookies to improve your experience. To help us insure we adhere to various privacy regulations, please select your country/region of residence. If you do not select a country, we will assume you are from the United States. Select your Cookie Settings or view our Privacy Policy and Terms of Use.
Cookie Settings
Cookies and similar technologies are used on this website for proper function of the website, for tracking performance analytics and for marketing purposes. We and some of our third-party providers may use cookie data for various purposes. Please review the cookie settings below and choose your preference.
Used for the proper function of the website
Used for monitoring website traffic and interactions
Cookie Settings
Cookies and similar technologies are used on this website for proper function of the website, for tracking performance analytics and for marketing purposes. We and some of our third-party providers may use cookie data for various purposes. Please review the cookie settings below and choose your preference.
Strictly Necessary: Used for the proper function of the website
Performance/Analytics: Used for monitoring website traffic and interactions
Lemkin (@jasonlk) May 22, 2025 The Early Days: Solving a Real Problem (2017-2018) Jacob Eiting and Miguel Carranza weren’t trying to build a unicorn when they started RevenueCat in 2017. The Problem Was Real: Apple and Google’s app stores weren’t giving developers the data they needed.
So SVB still is the #1 bank for tech companies in Silicon Valley and they have a ton of data. The data shows down rounds comprised 30-50% of IPOs even during “good” periods. They have 24% of all U.S. VC deals now come from accelerators and incubators — and that's going way up.
The mobile phone user has the highest NPS as a BILL user because it’s super simple and easy, and the clerk does all the data entry, pulling everything in and managing it. Then, in 2017, with around $50M in revenue, BILL added payment capabilities. Then, you get to the people who need to approve a transaction. That was probably 2012.
Here’s a comprehensive overview of the major candidates: Company Founded CEO Sector Est. Revenue Valuation IPO Timeline Databricks 2013 Ali Ghodsi Data Analytics $2.4B $62B 2025-2026 Netskope 2012 Sanjay Beri Cybersecurity $487M $7.5B 2025-2026 Anduril 2017 Palmer Luckey Defense Tech $1B $30.5B valuation, raised $2.5B
Think your customers will pay more for data visualizations in your application? Five years ago they may have. But today, dashboards and visualizations have become table stakes. Discover which features will differentiate your application and maximize the ROI of your embedded analytics. Brought to you by Logi Analytics.
For example, take a look at how our Content team worked together back in 2017 to plan our editorial calendar. Next, I fill my outline with research – data, statistics, expert quotes, examples – and other valuable information to support my argument or advice.
As the co-founder and CEO of leading fintech company, OakNorth , – valued at over 1 billion – he has revolutionized lending for scale-up businesses through advanced data analytics, providing fast, flexible financing solutions for SMEs. As co-founder and CEO of Wayve , he is transforming transportation with AV2.0, Backed by 1.93
Youre deploying smart devices, generating rich telemetry data, and providing actionable insights to customers. Manual data entry. Maybe even macros from 2017. Youre deploying smart devices, generating rich telemetry data, and providing actionable insights to customers. But back at HQ? Your billing process lives in Excel.
Inside Snowflake’s Board Meetings: How AI is Reshaping Enterprise Data and the Future of B2B Partnerships We had a lot of fun at SaaStr AI Summit 2025 with a rare look inside Snowflake’s boardroom! AI Will Reshape Technical Roles in 18 Months (or Less) : Data engineers will become orchestrators rather than code writers.
In this comprehensive guide, well walk through the LLM training process step by step from raw data collection and data preprocessing for LLMs to tokenization in NLP , model architecture design, and the heavy compute requirements for training large language models. Step 2: Data Pre Processing Cleaning and filtering the raw text data.
Product release highlights include: ChartMogul Benchmarks Our revamped approach to data cleaning When should you recognize churn? Check out the 2023 , 2022 , 2021 , 2020 , 2019 , 2018 , 2017 , and 2016 posts. 2024 has been our most innovative year since launch, and weve still got a few product surprises to reveal before the holidays.
So we’ll jump you in a time machine and go back to whatever moment sticks out in your head. Fred Viet: It’s more an advice that I receive. And I think it was in the first two years of my career. Fred Viet: You start, you think you’re really good, and you’ve got a lack of self-awareness. You don’t go really deep.
discovered that incentivizing work email signups through calendar integration created a powerful enterprise data collection engine. Here’s why it matters: Auto-syncs with work calendars Creates a map of enterprise usage patterns Provides sales teams with targeting data Enables identification of key decision-makers The result?
The Numbers Don’t Lie: A Tale of Two Eras The Golden Age (2017-2018): When VCs Were Heroes Looking at 2017 funds—the darlings of the previous cycle: 81% returned capital after 5+ years Median IRR of 11.5% (that’s actually good!)
which was acquired by Oracle in April 2017. How Yext evolved from managing listings to powering AI-ready data pipelines. The role of hyperlocal data, competitive analysis, and personalized content in GTM strategy. 18:00 Practical data strategies for local businesses and SaaS marketers.
These platforms track seller behavior, detect policy violations, and provide brands with actionable data to trace violations to the source. Since its relaunch in 2017, Amazon has offered brand owners better tools to control how their products are represented and sold. Leverage Amazon Brand Registry 2.0
You should also place greater emphasis on generating third-party brand mentions and using schema markup (structured data). Here’s a short timeline that puts AI Mode in context: May 2017: CEO Sundar Pichai announces the launch of a dedicated AI division called Google AI at I/O, the company’s annual developer conference.
Mobile devices have generated over 50% of all website traffic since 2017, so use a mobile-first approach during your redesign process to appeal to the largest percentage of users. Since 2017, mobile devices have generated over half of website traffic. Bad Mobile Experience Is your site the opposite of mobile-friendly?
Mastodon The top 23 social media apps and platforms for 2024 This list is ranked by the latest data on monthly active users (MAUs)*. Despite only launching in 2017, it’s one of the fastest-growing apps in the world and recently overtook Google as the most visited internet site. LinkedIn 16. Discord 18.
With high-profile speakers and data-driven sessions, this event helps marketers and creators stay sharp in a rapidly evolving industry. Here's what's interesting: we started out with a simple "$500 per person" approach back in 2017. Expo area showcasing the latest marketing tools, trends, and solutions.
Today is January 10, 2017. In less earth shattering news, the fact that it's 2017 also means that my "SaaS Funding in 2016" napkin needs an update. Today I'd like to take a stab at the (early) 2017 answer to that question. So, what does it take to raise capital, in SaaS, in early 2017? It still feels surreal to me.
Comparing 2017 averages to seven year highs, we observe Series A, Series B, and Series Seed round sizes are effectively at their all-time highs, ignoring some minor differences. Should the current trend continue, 2017 would see the fewest number of rounds since 2012, and a 45% reduction from 2014 high. billion from $4.2
Machine learning startups continue to raise ever more capital, as do big data companies. And this data implies that fewer earlier stage companies raised, which means there will be fewer Series Bs in 2017 and fewer Series Cs in 2018. Cybersecurity investments are classic hockey stick.
As the year is coming to an end I’d like to share a few thoughts on what we’ll be looking for in the SaaS world in 2017. It will be extremely interesting to see which companies can accomplish a similar quantum leap in 2017 and how it will look like. Will it be a SaaS solution with voice as the primary form of input?
So Carta has some of its latest data on VC performance and it’s pretty interesting: There’s a lot going on this chart but let me break it down from a founder perspective: The median 2017 fund is 7 years into a 10-14 lifetime — and is sitting at 1.8x “TVPI” But it’s not quite that good.
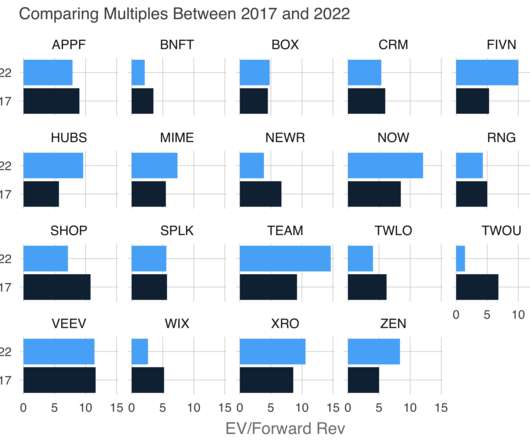
I went through my archives and found this post from 2017 that showed that the most expensive stock at the time was Veeva at 11.7x If the valuation environment mirrors 2017, CloudFlare’s multiple would halve again. In 2017, the average company traded at 5.4x Today, CloudFlare tops the list at 22.2x.
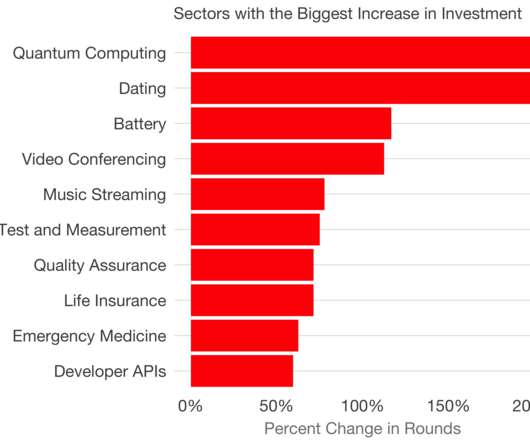
Here are 2015 , 2017 , This year, I was certain the categories would have been influenced by COVID19. I analyzed Crunchbase data and looked for the startup categories that grew fastest in terms of funding rounds year-over-year, provided there were at least 10 rounds in that category.
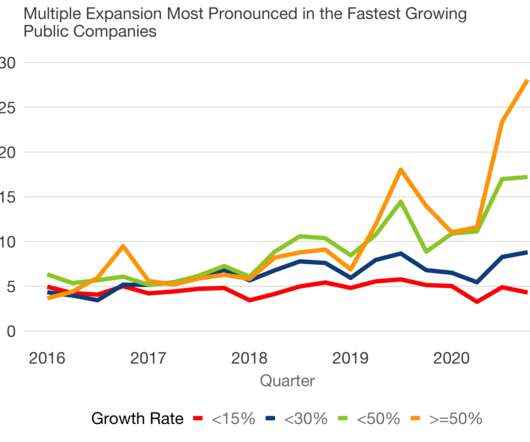
Let’s excise this group of 50% growers from the rest and add Redpoint internal data for forward ARR multiples for later-stage companies, which are all growing above 50%. In 2017 and 2018, the median high-growth private company raised at a higher forward ARR multiple than in the public markets.
60%+ of our speakers have been less represented speakers since 2017 and all our IRL events since 2017 have had a majority of women speakers.W. Presentations with data are the best. Submit for any of our events here. Please also review our detailed guidelines here. In a nutshell: We prioritize diversity. No repeats.
But the average MRR has increased substantially from the last time I analyzed the data. I didn’t calculate this figure in 2017. The usual caveats to this data analysis apply. note I’m switching from median to average here). In 4 years, we’ve seen a 4x increase in the median MRR of a Series A SaaS company.
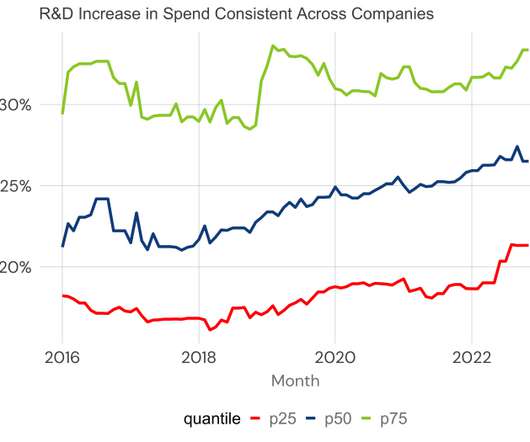
Starting in 2017 when the data is richer, the PLG companies increased R&D spend from 27.5% There’s no doubt from this data PLG companies spend more on R&D to grow. I categorized these companies by their primary motion: sales or product-led. Sales-led companies have oscillated around the 25% mark.
This was around 2017, and CS became simpler and focused on post-sales, retention, and reduced churn. Do you want a system that automates playbooks, presents usage data to the team, or creates and tracks a health score? Instead, it was a cross-functional, data-driven, experimental team. Side projects are not a recipe to scale.
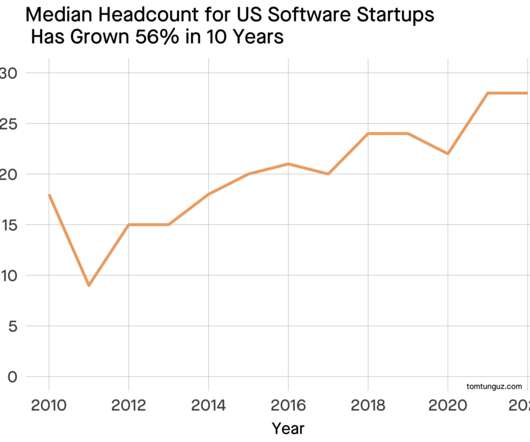
Today, the public markets value companies like it’s 2017. 1] Thank you to the Pitchbook team for running the headcount analysis data. [2] At 28 employees, a $16m Series A fueled the company for 35 months. That’s a lot of buffer to achieve Series B metrics [1]. But we’re no longer in 2021.
We’ve had a majority of women speakers since 2017, and aim for 66% less represented speakers. And one thing we got from 7+ major digital events, each with 50,000+ viewers and 5,000-20,000 registrants is a lot of data. We’re not close to perfect and keep learning. Since Covid hit though, we did a lot of digital events.
#1 source of traffic to [link] : 2022: SEO 2021: SEO 2020: SEO 2019: SEO 2018: SEO 2017: SEO 2016: SEO 2015: SEO 2014: SEO 2013: SEO 2012: SEO. Every single year I look at SaaStr.com data, Organic Search is #1 : Interestingly, even in 2012. Even Year 1 pic.twitter.com/5FtzBG2v1O. — Jason BeKind Lemkin #????????????
In 2017, he was named by LinkedIn as one of the top 5 CMOs in the world to follow for thought-leadership in the digital marketing domain. Chandar also spent years at Andersen Consulting (now Accenture) as a strategic advisor to Fortune 500 companies. He is a Strategic Advisor to the CEO of Freshworks.
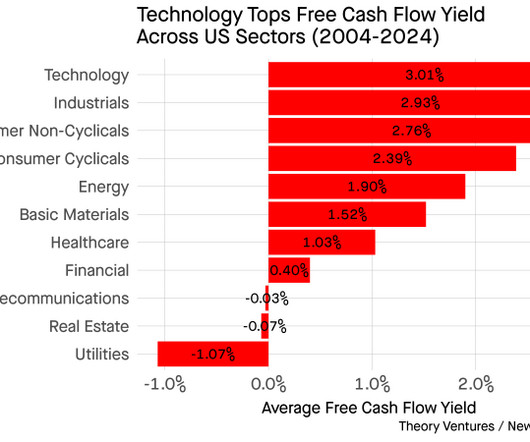
In 2017, the industry migrated from ASC 605 to ASC 606, which are financial arcana as esoteric as it reads. Software companies top the charts at 3% over the last 20 years, according to data from New Constructs , a financial research firm. Quite a stark difference. Profitability for software companies isn’t straightforward.
With Slack’s IPO data and financials finally public, what is left to know about the app we all use and have been reading about for years? That’s way, way up from just 22% of revenue from $100k+ deals in 2017. He was granted an additional 3m shares in 2017 and 1.3m The big deals also take time, even for Slack.
This one from 2017 Annual is really one of my favorite deep-dives with one of the top SaaS CEOs of all time. 5: “The “Dos & Don’ts” of Building Winning SaaS Companies with G2 Crowd” Godard shares from data what scales and what doesn’t in SaaS. #6. A SaaS classic on how to build a unicorn. #5:
5000 “ It was a fun one, analyzing the only public source of data on just how much ARR a lot of SaaS companies had. Where it Went: $45m revenue in 2017 and reported $100m+ in 2021, but acquired for modest sum in 2021. Where it Went: Acquired for $850m+ by Sage in 2017. No one had IPO’d, no one really knew.
(Note: I wrote a version of this in 2017 when times were good. Analyze that data more. It’s just as relevant today, more so really, but thought it could use some updates. So here’s the 2020+ version). __. Hopefully, you are one of the 15% or so of SaaS companies getting a boost from these crazy times. At least a bit.
from 2015 to 2017, a compound annual growth rate of 35%. This decrease is driven by user policy changes that affect users who have been inactive for a year or more, and a shift to operating their own data centers instead of using cloud providers. MC/2017 Rev Multiple. Dropbox’s revenue grew from $604M to $1.1B Market Cap.
— Drew Houston (@drewhouston) January 30, 2017. Dropbox’s margins are just as high as SaaS companies that store only a trivial amount of data. Today we announced that @Dropbox is the fastest SaaS company ever to reach a $1 billion revenue run rate! pic.twitter.com/Rn13KiwnyG. Well, that was wrong.
One of the clearest examples of how lopsided the services-to-software dynamic can be is from Mulesoft’s S1 filing in 2017. The shift from on prem to cloud data warehouses is a perfect example of this. Vertica / Netezza and other on prem data warehouses were very expensive!
We organize all of the trending information in your field so you don't have to. Join 80,000+ users and stay up to date on the latest articles your peers are reading.
You know about us, now we want to get to know you!
Let's personalize your content
Let's get even more personalized
We recognize your account from another site in our network, please click 'Send Email' below to continue with verifying your account and setting a password.


Let's personalize your content