This site uses cookies to improve your experience. To help us insure we adhere to various privacy regulations, please select your country/region of residence. If you do not select a country, we will assume you are from the United States. Select your Cookie Settings or view our Privacy Policy and Terms of Use.
Cookie Settings
Cookies and similar technologies are used on this website for proper function of the website, for tracking performance analytics and for marketing purposes. We and some of our third-party providers may use cookie data for various purposes. Please review the cookie settings below and choose your preference.
Used for the proper function of the website
Used for monitoring website traffic and interactions
Cookie Settings
Cookies and similar technologies are used on this website for proper function of the website, for tracking performance analytics and for marketing purposes. We and some of our third-party providers may use cookie data for various purposes. Please review the cookie settings below and choose your preference.
Strictly Necessary: Used for the proper function of the website
Performance/Analytics: Used for monitoring website traffic and interactions
Based on internal analysis of industry data, we estimate the customers of trades businesses, which we refer to as “end customers,” spend approximately $1.5 ”” Benchmark Data The data shown below depicts how the ServiceTitan data compares to the operating metrics of current public SaaS businesses.
Anyone who has managed a larger BI deployment has faced the challenge of managing hundreds, perhaps thousands of metrics. In the BI tool, a marketing analyst finds three metrics: cost_of_customer_acq, CAC2, & new_CAC. Data brawls - disputes between teams about metrics definitions - break out. Give it a try here.
Some fun facts: 10+ years of SaaStr conference attendance Partner at Point Nine Capital, a leading early-stage VC firm Geographic reach: Actively investing across Europe, US, and Australia Notable portfolio: Zendesk, Algolia, Contentful, Loom (and many more) Known for his “five ways to build a $100M business” framework The 5 Key Things (..)
So we’ve covered HubSpot more than any other SaaS leader on this 5 Interesting Learnings series, in part because so many of us use HubSpot ourselves, and in part because its metrics and use cases are so like many of the apps we build and sell ourselves. 5 More Interesting Learnings then: #1. I think for many today, this would be late.
Product teams have access to tons of data these days—volumes more than we’ve ever had before. Overcoming it requires knowing exactly which metrics are the most important to track. But the sheer scale of what's available has many of us at a loss for how to best harness it all to measure product success.
Robots read pdfs that customers provide and input that data into other computer systems. Customer support teams might use RPA robots to read the contents of an email, find an order number, look up the order, and present the support agent with some key data. Some examples include streamlining customer onboarding.
Our platform unifies core financial and broader operational data and processes within a single platform, with solutions that maintain the integrity of corporate reporting standards for Finance while providing operationally significant insights for business users. You can some metrics below based on different share prices.
to send 35B+ messages, there’s enough data to show what actually works. Let’s break down the real metrics from companies doing this right. 5 Non-Obvious Learnings from Customer.io’s Platform Data 1. These focused groups saw 3x higher engagement rates and provided cleaner data for optimization.
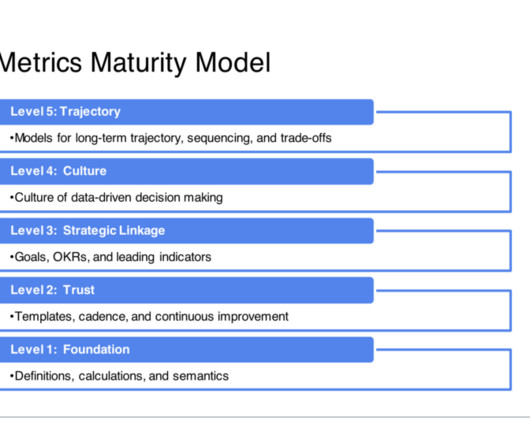
Dave Kellogg, EIR at Balderton Capital and 25-year C-level veteran, shares the top 14 signs that you have a SaaS metrics problem, the five reasons those symptoms exist, and a SaaS metrics maturity model with five layers to help you move the needle at every stage. The 15 Types of Misuse and Abuse of SaaS Metrics #1: Bludgeoning.
Speaker: Hannah Chaplin - Product Marketing Principal & Steve Cheshire - Product Manager
Without product usage data and user feedback guiding your product roadmap, product managers and engineers end up wasting money, time, and effort building what they think stakeholders want, rather than what they know they need. To accomplish this, product teams must regularly evaluate specific metrics that will yield the most insight.
Think emails in your inbox, glitter on a Mother’s Day card, hot sauce… That applies to social media metrics, too. Not all social media metrics are created equal, and which ones to focus on comes down to your specific social media goals. What are social media metrics? You might be surprised to hear it.
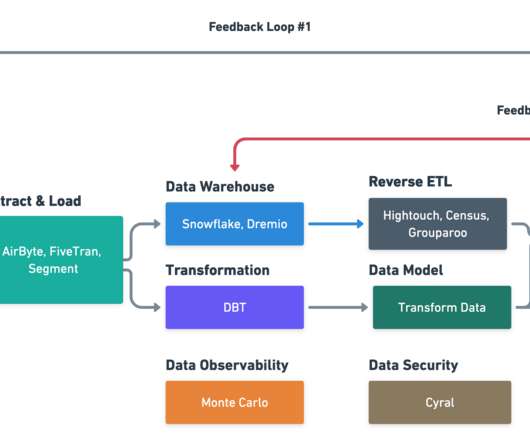
About a year ago, I wrote a post on the hub and spoke data model. Instead, the SaaS ecosystem and the data ecosystem are moving in this direction on their own. Here’s a schematic (click to enlarge) that describes how data flows with a cloud datawarehouse (CDW) fed SaaS app. This may be the next shift.
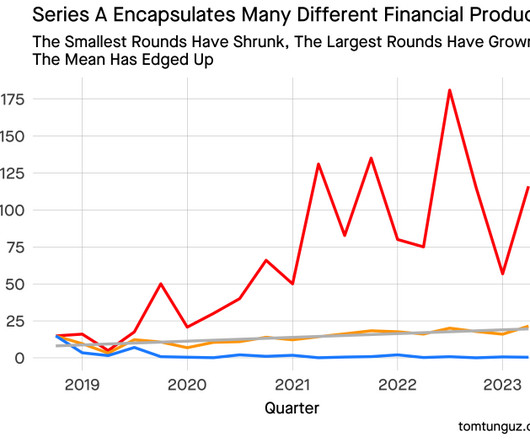
In There’s No Such Thing as Series A Metrics , Charles Hudson explains that there is no magic milestone to raise a Series A. But the data shows how much the market differs from a few years ago. The second reason for a lack of consistent metrics for Series A has to do with perturbations in purchasing behavior.
Though it seems counterintuitive to maximize revenue, Miro intentionally set the threshold high enough that when someone bought Miro, they were getting the collaborative value because the users needed to use the product as a team vs an individual (which early data showed the highest churn in).
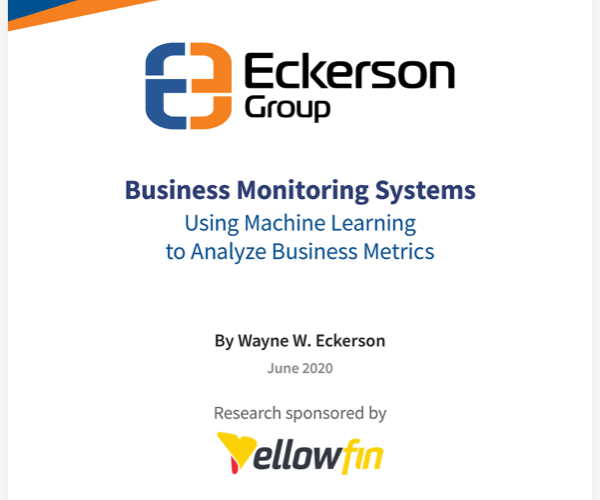
This whitepaper discusses how automated business monitoring solutions like Yellowfin Signals revolutionize the way users discover critical and relevant insights from their data. Download to learn: 5 business benefits of automated data discovery with ABM. The evolution of dashboards to automated business monitoring.
Improving Rev Ops for Data-Driven Decision Making One of Lindsey’s first priorities was diving deep into the company’s existing data to identify trends and leverage these findings for growth. The team lacked visibility into key metrics like average revenue per customer.
” – Alex Rosenblatt The Channel-First Approach That Actually Works Instead of the everything-at-once approach, Rosenblatt advocates for a methodical, data-driven methodology: 1. Schedule regular deep dives into performance metrics to maintain your edge. Markets change, competitors emerge, and platforms evolve.
CAC Payback Period Predicts Success More Accurately Than Any Other Metric CAC payback period stands above all other SaaS metrics as the most holistic indicator of business health. Unlike isolated metrics like growth rate or gross margin, CAC payback simultaneously reflects market demand, go-to-market efficiency, and product quality.
Metrics are the key to evaluating success and setting goals, but not every SaaS business should orient itself around the same one-size-fits-all numbers. This flexible mindset creates just the right conditions for embracing evolving business models and new metrics. The Metric Monolith: The Rise and Fall.
Use metrics like product usage, NPS, and engagement to identify risks early. Focus on Net Retention Net retention is the ultimate metric for customer success. But in the earliest days, NRR is the simplest core metric for Customer Success. Measure Everything Customer success needs to be data-driven.
On Monday, at TC Disrupt Colin Zima CEO of Omni , Jordan Tigani CEO of Motherduck , Daniel Svnova CEO of Superlinked & Toby Mao CTO of Tobiko Data who are leading the evolution of the Post Modern Data Stack discussed the trends they are seeing. Most data workloads are quite small, about 100MB. Vectors power AI systems.
The event is known for its focused content on SaaS growth strategies, metrics, and best practices, making it particularly valuable for B2B SaaS companies. It’s the largest non-vendor SaaS conference in the world, typically drawing over 12,000 SaaS founders, executives, and investors.
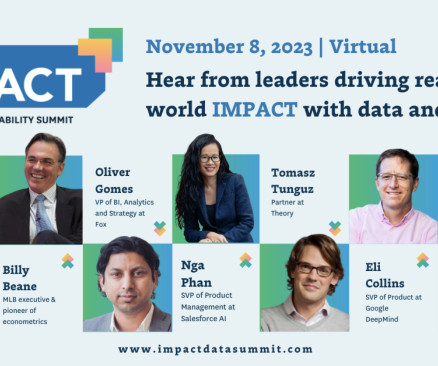
On November 8th, I’ll share my 10 Top Trends in Data & AI at the IMPACT Summit. Last year, I covered 9 topics: Cloud data warehouses will process 75% of workloads by 2024. Data workloads segment into in-memory, cloud data warehouse, & cloud data lakes. Metrics layers unify the data stack.
Speaker: Edie Kirkman - VP, Digital at Focus Brands
To overcome this challenge, it is crucial to build core product and technology competencies that provide actionable insights through qualitative and quantitative data analysis. By leveraging data-driven insights, companies can accelerate time-to-market, enhance product quality, and align offerings with customer needs.
And now we have enough data to add Threads to our roster, too! And now we have the data to prove it. Our primary metric for this study was median engagement by hour, day, and content type. Posts published then had the highest median engagement — that is likes, replies, and reposts — across all the data we analyzed.
Consider a hybrid approach : You can start with third-party APIs while building your data foundation, then gradually move to custom solutions as you scale. Domain Data Is Your Secret Weapon Dialpad’s massive advantage comes from their 8 billion minutes of processed conversations.
Data from Stripe (below) shows the speed at which AI native companies are growing compared to SaaS companies. If you wanted to scale users and growth, you needed to scale a physical data infrastructure footprint. If we look at the NetSuite S-1 (filed in 2007) they said this: “We use a single data center to deliver our services.
Usage data feeds product-led growth (PLG) lead scores, enabling account executives to outbound to the most promising users. Longer sales cycles : Recent data shows usage-based pricing models experienced 29% longer sales cycles in 2023 compared to 21% for seat-based companies. Sales teams lose leverage.
We’ve all got loads of data at our fingertips. Which metrics are the most valuable to keep an eye on? In this eBook, we share the top 10 KPIs every product pro should know. Some of them might already be familiar to you, but others will be brand new.
But a useful metric to understand nevertheless. More on that data here: It’s Taking Longer and Longer to IPO. Fast forward to today, the “average” SaaS company that IPO’s … takes 13.6 years to get there. Some clearly could have IPO’d much earlier. Years Or More For The Next Batch.
Klaviyo Overview From the S1 - “Klaviyo enables businesses to drive revenue growth by making it easy to bring their first-party data together and use it to create and deliver highly personalized consumer experiences across digital channels. ” “Data Layer. ” “Data Layer.
4 Unexpected Learnings from Databricks’ Sales Growth Machine Calendar scraping reveals top performers spend disproportionate time on new prospects – Databricks uses calendar data to track how their best AEs allocate time, discovering that overachievers focus on prospect development over existing accounts.
What data and metrics do you need to convince SaaS investors you’re in good shape and aligned with what they care about? These metrics are more targeted to those preparing for a Series A or B round and could make the difference between an excited-to-invest-in-you investor and a pass.
Multiple industry studies confirm that regardless of industry, revenue, or company size, poor data quality is an epidemic for marketing teams. As frustrating as contact and account data management is, this is still your database – a massive asset to your organization, even if it is rife with holes and inaccurate information.
Meeting intensity KPI challenge : Sometimes AI efficiencies can reduce a company’s core metrics (like Calendly’s “meeting intensity”), requiring leadership to make conscientious decisions about value tradeoffs. Data quality requirements User experience impact 4. Cost structure (can we sustainably deliver this?)
At the IMPACT Summit yesterday, I shared our Top 10 Trends for Data in 2024. LLMs Transform the Stack : Large language models transform data in many ways. First, they have driven an increased demand for data and are causing a complete architecture inside companies. Second, they change the way that we manipulate data.
It’s to say many of us do not know how to use AI effectively enough yet to impact conversion metrics. #6: However, when Theory layered in the actual data to see how much more efficient they were year-over-year, the numbers were between -4% and 4%. So how much business has it closed?
Kazuki Ohta, CEO & Founder at Treasure Data, shares his company’s story of how pivoting at the right time saved their business and accelerated their growth to $100 million ARR. When it launched in 2011, Treasure Data’s positioning was a Hadoop-based big data warehouse in the cloud. The Platform: $0 – $5 Million ARR.
Numerous high-profile examples demonstrate the reality that AI is not a default “neutral” technology and can come to reflect or exacerbate bias encoded in human data. How to choose the appropriate fairness and bias metrics to prioritize for your machine learning models.
Time-to-value is your most critical early metric. Time-to-value plummeted Expansion revenue became almost automatic Sales cycles got more honest and efficient The 5 Things We Learned About Customer Success at $100M+ ARR Sales actually exaggerates. Shocking, I know. But a great CS team keeps promises realistic and achievable.
So Carta has some interesting new data from all of its start-ups from The Class of 2018 here. Cartas data suggests 30%-35% of start-ups that are able to raise a seed round fail in 7 years. Carta says they do, though In any event, these metrics are very useful and directionally correct. Every start-up dataset is a bit different.
Rubrik, a Palo Alto-based data security company, filed their S-1 yesterday. In fiscal 2023, we began transitioning customers from our legacy CDM (Cloud Data Management) capabilities to our subscription-based RSC offerings. 41% of new bookings derives from those new customers. The legacy business fell by 58%.
Rep Performance : Dive into individual and team performance metrics. Metrics like time spent in each stage and reasons for lost deals can provide clarity. And remember, the more data-driven you are, the better your results will be. Look at quota attainment, activity levels (calls, emails, demos), and conversion rates.
Greg Loughnane and Chris Alexiuk in this exciting webinar to learn all about: How to design and implement production-ready systems with guardrails, active monitoring of key evaluation metrics beyond latency and token count, managing prompts, and understanding the process for continuous improvement Best practices for setting up the proper mix of open- (..)
We organize all of the trending information in your field so you don't have to. Join 80,000+ users and stay up to date on the latest articles your peers are reading.
You know about us, now we want to get to know you!
Let's personalize your content
Let's get even more personalized
We recognize your account from another site in our network, please click 'Send Email' below to continue with verifying your account and setting a password.


Let's personalize your content