

ServiceTitan: Benchmarking the S1 Data
Clouded Judgement
NOVEMBER 18, 2024
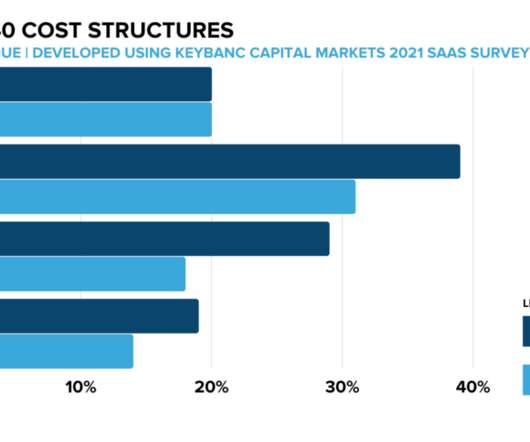
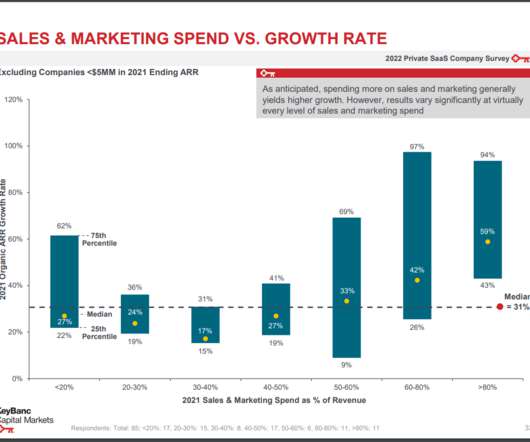
There’s a lot of info to digest, so in the sections below I’ll try and pull out the relevant financial information and benchmark it against current cloud businesses. ”” Benchmark Data The data shown below depicts how the ServiceTitan data compares to the operating metrics of current public SaaS businesses.


Let's personalize your content