


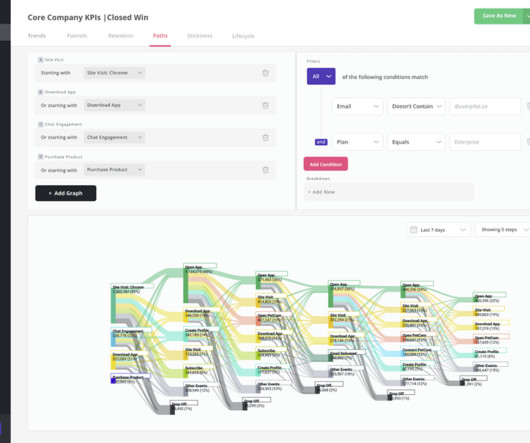
Charting the Data: Three Takeaways From Working On an Analytics Product
Chart Mogul
AUGUST 10, 2021
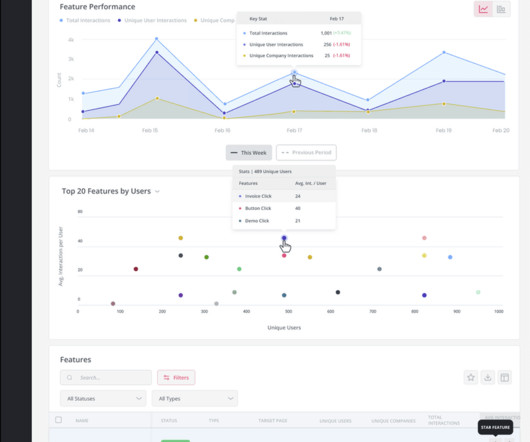
If a picture is worth a thousand words, then a good chart is definitely a match for even the most verbose images. This might help explain why analytics are everywhere. Analytics … If a picture is worth a thousand words, then a good chart is definitely a match for even the most verbose images.


Let's personalize your content