This site uses cookies to improve your experience. To help us insure we adhere to various privacy regulations, please select your country/region of residence. If you do not select a country, we will assume you are from the United States. Select your Cookie Settings or view our Privacy Policy and Terms of Use.
Cookie Settings
Cookies and similar technologies are used on this website for proper function of the website, for tracking performance analytics and for marketing purposes. We and some of our third-party providers may use cookie data for various purposes. Please review the cookie settings below and choose your preference.
Used for the proper function of the website
Used for monitoring website traffic and interactions
Cookie Settings
Cookies and similar technologies are used on this website for proper function of the website, for tracking performance analytics and for marketing purposes. We and some of our third-party providers may use cookie data for various purposes. Please review the cookie settings below and choose your preference.
Strictly Necessary: Used for the proper function of the website
Performance/Analytics: Used for monitoring website traffic and interactions
Dear SaaStr: What Are The Rough Benchmarks for Raising a Series A? When it comes to raising a Series A, the benchmarks can vary depending on your market, growth trajectory, and the type of B2B business you’re building. That’s the sweet spot where you’ve proven some level of product-market fit and initial traction.
Learning #2: Size Matters More Than You Think – Your Growth Benchmarks Are Completely Wrong This might be the most important insight in the entire report: A 25% growth rate means completely different things depending on your ARR. The takeaway: Stop chasing the unsustainable growth rates of 2021-2022. They’ll be the cautionary tales.
SMB, mid-market, enterprise). Benchmark Your GRR : Investors will compare your GRR to industry standards: Enterprise SaaS: 90-95% Mid-market SaaS: 85-90% SMB SaaS: 80-85% Anything below these benchmarks signals potential retention issues 3. Segment by Customer Type : Break down GRR by customer segments (e.g.,
What “Working” Means in the Era of AI Apps: The New Enterprise Benchmarks That Matter One of the most common refrains in the generative AI era is that “startups are growing faster than ever” — often with fewer resources. ARR by month 12 — more than double the old “best in class” benchmark of $1M.
Early Stage (Sub-$1M ARR): At this stage, your primary goal is survival and proving product-market fit. Quotas should now be tied to historical performance and benchmarks. For low-five-figure deals, 25–30 active opportunities per rep is a common benchmark. Here’s how I’d break it down: 1. And Their Quota.
Speakers share their playbooks on everything from achieving product-market fit to optimizing CAC:LTV ratios and scaling go-to-market strategies. SaaStr Annual attracts thousands of high-quality SaaS professionals across functions like engineering, product, marketing, sales, and customer success.
Productmarketing metrics are key for understanding and optimizing the performance of your product. They help you measure success, identify areas for improvement, and align your product management strategies with your overall business goals. Time-to-value : Tracks how quickly users realize the value of the product.
These metrics are the result of exceptional productmarket fit. If we examine net dollar retention, the current value of last year’s cohort today net of churn and gross of expansion, we see Zoom is in the top decile at 140%. Exceptionally fast and efficient growth define Zoom, the next iconic video conferencing platform.
“We just need one great CMO who can do it all” – Founders often search for a marketing unicorn who excels at brand, demand gen, productmarketing, and digital programs. A smaller number of high-quality leads that convert at higher rates is vastly superior to a flood of poor-fit prospects.
Monday.com Has Achieved Rule of 40 with Room to Spare The Rule of 40 (growth rate + profit margin should exceed 40%) is a benchmark for successful SaaS companies. This suggests they’ve found product-market fit across multiple customer segments, from SMBs to enterprises, and can effectively sell at multiple price points.
There are even a lucky few marketers who hardly noticed it—at least in terms of their conversions. That elusive product-market fit just kinda works itself out when you’re peddling business casual pajamas.). And how has the digital marketing landscape changed between the simpler days of 2019 and today?
Compare that to the benchmarks in 2013! Snowflake is second, pushed by their best-in-class net dollar retention (NDR). Both these companies also focus on enterprise accounts - in contrast to Bill.com at the bottom, which targets small businesses. In addition to the dated charts! I wonder what trends we’ll see in 2033.
web analytics, in-app surveys , product analytics). Set benchmarks and targets using industry standards. Userpilot is a product growth platform that you can use to collect, visualize, and analyze user behavior data in custom dashboards. Set benchmarks and targets Vanity metrics tend to lose their meaning without proper context.
Because it is the single most important factor in product success. Retention is not only the primary measure of product value and product/market fit for most businesses; it is also the biggest driver of monetization and acquisition as well. Create a new product : Struggling to retain users at all?
How much should a SaaS startup invest in sales and marketing at different stages of the business? This is a very nuanced question, but benchmarks do provide some guidance for what is reasonable. It’s not a fully fledged model, but a very basic scenario forecasting tool.
Productmarketing is the process of bringing a product to market, and a well-curated productmarketing strategy is key to understanding customer needs and driving adoption. TL;DR A productmarketing strategy is a roadmap for how a new product will be positioned, priced, and marketed.
According to our benchmark, the average month-1 retention rate in SaaS companies is 46.9%. Let’s explore our product metrics benchmark and learn: The definition of month-1 retention rate and why it matters. Check our product metrics benchmark report. Average month-1 retention statistics for different segments.
Cloud founders are feeling the pressure of the current climate, and it’s understandable why: They’re grappling with inflation, rising interest rates, and all of that against a backdrop of a compressing public market. . These cloud businesses have product-market fit, scalable GTM, and a growing customer base. .
See chapter 2 in the report to learn more about net retention benchmarks. In the pre-productmarket fit stage of the business, net retention is usually poor. As startups grow and find product-market fit, net retention improves. When benchmarking, always keep the stage of your business in mind.
Are you tracking the right ProductMarketing KPIs? With so many product growth insights available to every productmarketer, it’s sometimes hard to understand which metrics are relevant and which you should be tracking to measure the success of your productmarketing. What is ProductMarketing?
One-third of the companies that came out of Y Combinator were successful—in being acquired, going public, or hitting their growth benchmarks. Of course, if Amplitude were among the first one-third, the successful businesses, then lasting two years wouldn’t be a problem and there would be time to find the right product-market-fit.
We’re tasked with achieving product-market fit and driving growth, but we have no direct control over the people who build, market, and support it. Most new products never find their product-market fit. Understanding the product metrics Let’s have two products – A and B.
SaaS companies, presumably having achieved productmarket fit, quickly hire large sales and marketing teams. Sales teams require a certain amount of time to learn the product, the sales pitch and build a book of business to eventually achieve quota. In year 4, the paths diverge. Again, I’ve omitted the outliers.
With last year in the rearview mirror, we can look at OpenView’s 2020 Expansion SaaS Benchmarks Report to tell us how exactly COVID-19 impacted SaaS companies. The report’s authors already laid out how to get back to hyper-growth , and their article inspired me to share my predictions for 2021’s most important productmarketing trends: 1.
Product-Market Fit . Hitting $1M ARR is the benchmark to figure out if you have a product-market fit.” – Veronika Riederle, CEO @Demodesk. Going from $0 to $1M ARR is the first baby step for any SaaS startup. Getting the first ten customers is like shooting in the dark. How to get the first ten customers.
Looking for reliable metrics benchmarks to gauge your product performance and inform your decisions? That’s what you can find in Userpilot’s Product Metrics Benchmark Report. We also share 6 key insights for product managers that we found particularly interesting. Book the demo! Time to Value (TTV).
As a caveat, I'm going to mention some benchmark numbers but it's very important to note that none of these numbers can be viewed in isolation. Ideally you have strong organic growth (which is strong proof of product/market fit) as well as some success with paid customer acquisition channels (which can be scaled more easily).
Your next big product is probably right in front of you. Find productmarket fit again and again. If you are hiring for a role that you aren’t super familiar with, or at a scale you haven’t been at before, learn and benchmark first. Find it by watching what your customers do, not what they say. Which could you solve well?
How to Raise Capital: Preparation, Benchmarks, and Best practices [Webinar Recap]. They shared their experiences and insights into the importance of good data hygiene, how it impacts forecasting and funding, and using industry benchmarks to determine valuation. Raise Capital by Benchmarking Data to Determine Valuation.
At the bottom I noted what these phases usually mean in terms of the stage of your product and company and which funding level it typically corresponds with. Post product/market fit, pre scale As you’re slowly but surely getting to product/market fit and starting to get the first paying customers (yay!),
Pendo announced a new offering aimed to help startup companies accelerate product-market fit, and prove that product traction to early stage investors. The company also unveiled ProfitWell Benchmarks to see how your company stacks up against similar firms.
Efficient TTV highlights an optimized onboarding experience and provides a clear indicator of early product satisfaction. Here’s how to drive early value effectively: In-product value Measure TTV : Set a quantifiable benchmark for how long it should take a new user to reach their first “aha moment.”
This rivalry causes four major responses: Verticalization - compete with a horizontal player by picking one customer segment and building a product better suited to them. Trades market size for better productmarket fit. Segmentation - focus on SMB, Mid-Market, or Enterprise, to play where competition isn’t present.
However, they were wrong about these assumptions, which kept them from identifying gaps and assessing the extensibility of their Enterprise product-market-fit. Simply because their product was being used in a professional setting didn’t mean it was a product-market fit.
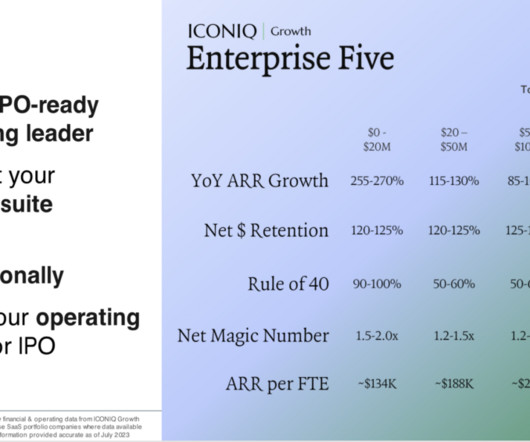
The four stages of growth are: Early stage Early growth Growth Pre-IPO Each of those stages has key GTM milestones, benchmarks, and team-building strategies that allow you to grow effectively. But to develop a GTM strategy, you must have ProductMarket Fit. The Early Stage — $0 to $20M ARR The early stage is crucial for GTM.
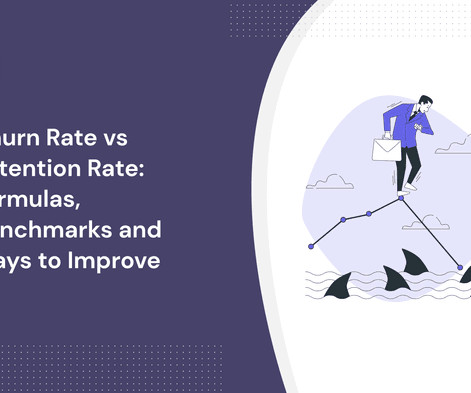
As opposed to this, early-stage startups will understandably have a higher churn rate, since they still may not have product-market fit yet. As a general rule, a 5% to 7% annual churn rate and around 1% or less monthly churn are considered acceptable churn rates for established SaaS companies. What is the customer retention rate?
High retention is a strong indication of product-market fit. Retention improves after you find product-market fit; it can go up to 78% when your business reaches $1m and later $3m in ARR. Companies with retention rates over 85% grow 1.5-3x 3x faster, in fact, which is a staggering number.
This week we released our third annual Expansion SaaS Benchmarks report. More than 500 SaaS companies participated in this year’s survey, which covered topics like financial performance, product led growth adoption, founder priorities and much more. But benchmarks alone are not enough.
What 14 startup investors & advisors taught us about chasing (and finding) product-market fit. It’s been a long-held notion in startup circles that lack of product-market fit will doom even the scrappiest of founders to fail. The problem with defining product-market fit. And this is what we heard.
What 14 startup investors & advisors taught us about chasing (and finding) product-market fit. It’s been a long-held notion in startup circles that lack of product-market fit will doom even the scrappiest of founders to fail. The problem with defining product-market fit. And this is what we heard.
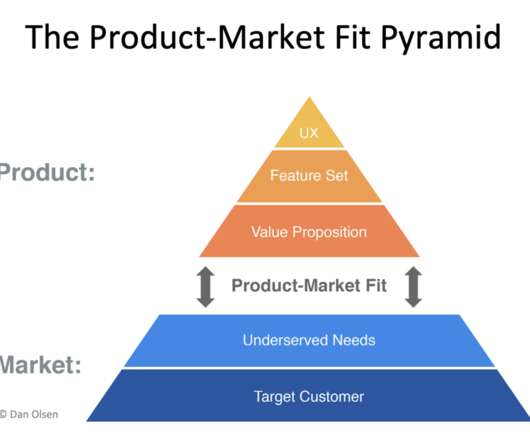
What is the product-market fit framework? How is productmarket fit different from product-customer fit? What should a product manager do to achieve and maintain the PMF? Product-market fit and product development are interconnected and happen in parallel. Let’s jump in!
The first goal is to share with you benchmarks. We believe benchmarks are really useful to help you build your business, because they provide good goalposts for financial planning and for goal setting. Our second topic, benchmarks around retention. There are two goals of this analysis. Logo retention.
The fastest growing SaaS companies see 89% annual logo retention and 109% net dollar retention (NDR) in their cohorts, according to data from OpenView’s SaaS benchmarking survey. Allows you to easily benchmark against peers on an ongoing basis. This is a great measurement of product stickiness and product-market fit.
I get asked these questions all the time by startup CEOs, CMOs, marketing VPs, and marketing directors. You can turn to financial benchmarks, like the KeyBanc Annual SaaS Survey for some great high-level answers. Or you can buy detailed benchmark data [1] from OPEXEngine. They’re not based on your operating history.
We organize all of the trending information in your field so you don't have to. Join 80,000+ users and stay up to date on the latest articles your peers are reading.
You know about us, now we want to get to know you!
Let's personalize your content
Let's get even more personalized
We recognize your account from another site in our network, please click 'Send Email' below to continue with verifying your account and setting a password.


Let's personalize your content