
Webinar Recap | Scaling Payments: Strategies to Attach and Amplify Processing Volume
Stax
JULY 2, 2025
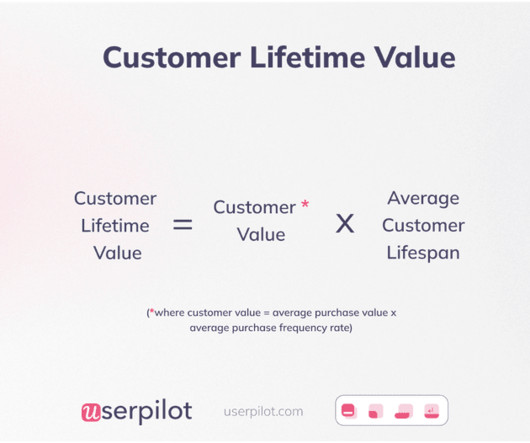
.” He emphasized that a tightly integrated payment solution does far more than just process transactions; it creates a stickier product and lower churn, which directly increases your customer lifetime value. Krahl highlighted the lucrative payment residual stream.


Let's personalize your content