This site uses cookies to improve your experience. To help us insure we adhere to various privacy regulations, please select your country/region of residence. If you do not select a country, we will assume you are from the United States. Select your Cookie Settings or view our Privacy Policy and Terms of Use.
Cookie Settings
Cookies and similar technologies are used on this website for proper function of the website, for tracking performance analytics and for marketing purposes. We and some of our third-party providers may use cookie data for various purposes. Please review the cookie settings below and choose your preference.
Used for the proper function of the website
Used for monitoring website traffic and interactions
Cookie Settings
Cookies and similar technologies are used on this website for proper function of the website, for tracking performance analytics and for marketing purposes. We and some of our third-party providers may use cookie data for various purposes. Please review the cookie settings below and choose your preference.
Strictly Necessary: Used for the proper function of the website
Performance/Analytics: Used for monitoring website traffic and interactions
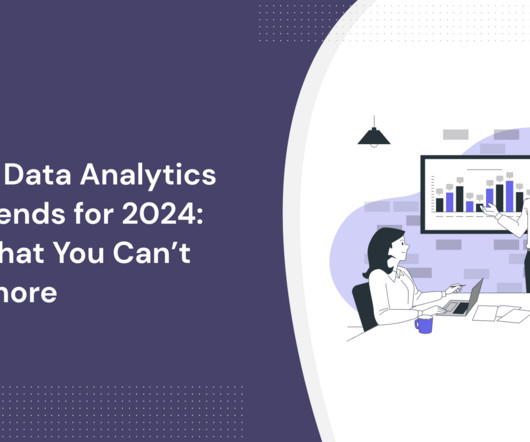
Does the thought of quantitative dataanalysis bring back the horrors of math classes? But conducting quantitative dataanalysis doesn’t have to be hard with the right tools. TL;DR Quantitative dataanalysis is the process of using statistical methods to define, summarize, and contextualize numerical data.
Let’s face it: qualitative dataanalysis is vital to understanding why users act in a particular way and how they feel about your product in a way that quantitative product analytics can’t. This article will teach you how to analyze qualitative data to inform product development and improve the product experience.
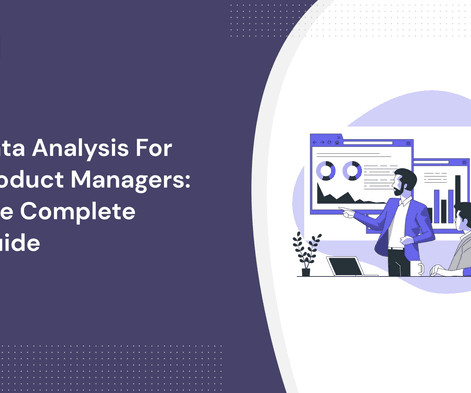
Dataanalysis is integral to a product manager’s job – it’s what helps them build impactful products. This article dives deep into dataanalysis for product managers. User dataanalysis helps: Provide direction for product development , allowing for effective resource allocation.
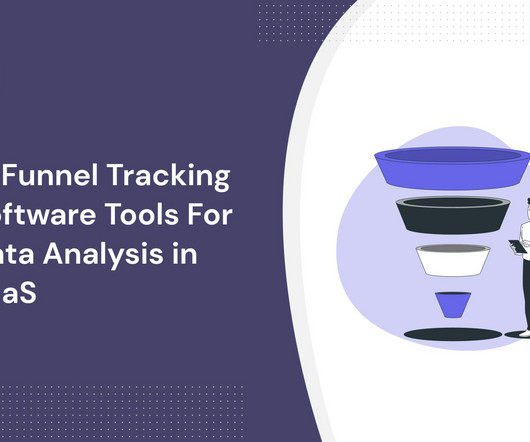
Here are the best funnel-tracking tools to explore: Userpilot is a product growth platform that gives you granular insights into your funnels with heatmaps, custom events, product usage tracking, and more. Custom event tracking : Create custom tags for events and track all in-app events to measure your engagement across the funnel.
A VP to manage them, 2 directors to manage half of the CSMs each, and probably an analyst to support her in dataanalysis, etc. (4). Director, Field Marketing (events, etc.). In Marketing, it can vary based on outside vendors, but I’m guessing 4-8 employees: VP Marketing. Director Demand Gen. Content Marketing.
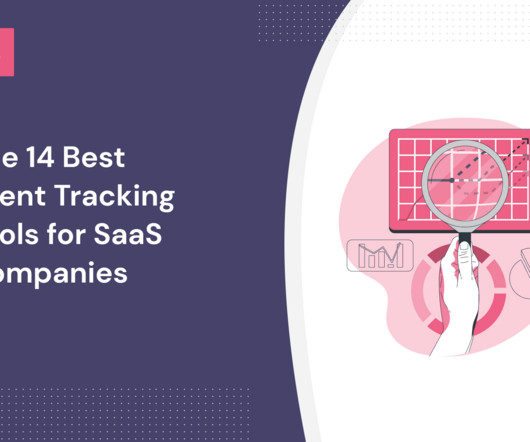
Choosing the best event-tracking tool for your business is not easy. To make the choice a bit easier for you, we’ve created a list of the best tools for tracking events available for SaaS teams in 2023. TL;DR An event-tracking system is an application for recording and analyzing user interactions with your product or website.
Cloud Data Lakes are the future of large scale dataanalysis , and the more than 5000 registrants to the first conference substantiate this massive wave. This time, the conference will build on the foundation from last year’s event. On January 27-28, Dremio host their second Subsurface conference.
Why is event-based analytics important for SaaS businesses? Event-based analytics allows product teams to gain insights into how customers are using their products. Event analytics helps you interpret user interactions, measure and improve overall product performance, and build personalized engagement.
Do you want to leverage eventdata to make data-driven decisions to enhance user experience? Eventdata allows you to understand your users’ behaviors and needs on a deeper level. It encompasses a wealth of data like user actions, feature usage, and beyond. What is eventdata?
Register for the event to gain expert insights and get all the details on how PayPal, Venmo, and Pay Later can drive more revenue for you and your merchants. Based on an internal PayPal dataanalysis of Pay Later retailers, October 2020 through August 2023. Webinar registration 1.
How do you create top-notch dataanalysis reports? It also covers: Why you need dataanalysis reports. Best analytics tools for creating dataanalysis reports. TL;DR Dataanalysis reports are documents used to share insights from the process of gathering and analyzing product and web data.
How do you create top-notch dataanalysis reports? It also covers: Why you need dataanalysis reports. Best analytics tools for creating dataanalysis reports. TL;DR Dataanalysis reports are documents used to share insights from the process of gathering and analyzing product and web data.
How do you create top-notch dataanalysis reports? It also covers: Why you need dataanalysis reports. Best analytics tools for creating dataanalysis reports. TL;DR Dataanalysis reports are documents used to share insights from the process of gathering and analyzing product and web data.
How do you create top-notch dataanalysis reports? It also covers: Why you need dataanalysis reports. Best analytics tools for creating dataanalysis reports. TL;DR Dataanalysis reports are documents used to share insights from the process of gathering and analyzing product and web data.
How do you create top-notch dataanalysis reports? It also covers: Why you need dataanalysis reports. Best analytics tools for creating dataanalysis reports. TL;DR Dataanalysis reports are documents used to share insights from the process of gathering and analyzing product and web data.
How do you create top-notch dataanalysis reports? It also covers: Why you need dataanalysis reports. Best analytics tools for creating dataanalysis reports. TL;DR Dataanalysis reports are documents used to share insights from the process of gathering and analyzing product and web data.
How do you create top-notch dataanalysis reports? It also covers: Why you need dataanalysis reports. Best analytics tools for creating dataanalysis reports. TL;DR Dataanalysis reports are documents used to share insights from the process of gathering and analyzing product and web data.
How do you create top-notch dataanalysis reports? It also covers: Why you need dataanalysis reports. Best analytics tools for creating dataanalysis reports. TL;DR Dataanalysis reports are documents used to share insights from the process of gathering and analyzing product and web data.
Quantitative data collection methods Close-ended survey questions : Restrict respondents to predefined answer options, such as “Yes/No” or multiple-choice selections, easily generating quantitative data for analysis. Event tracking : Monitor specific actions within your product (e.g.,
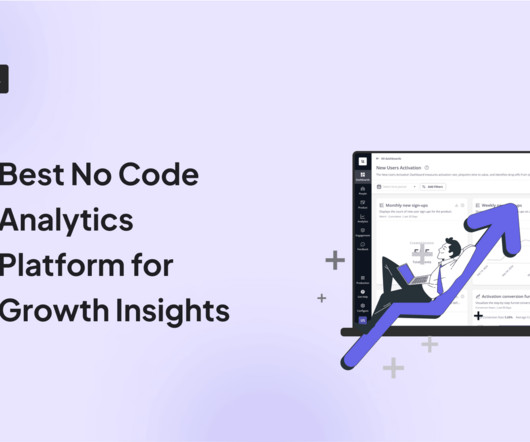
TL;DR No-code analytics tools offer intuitive, visual interfaces to collect, process, and analyze data. They usually come with drag-and-drop functionalities to allow users to create and track events without writing code. You can use no-code tools for various uses, like user journey mapping , behavioral analysis, and product adoption.
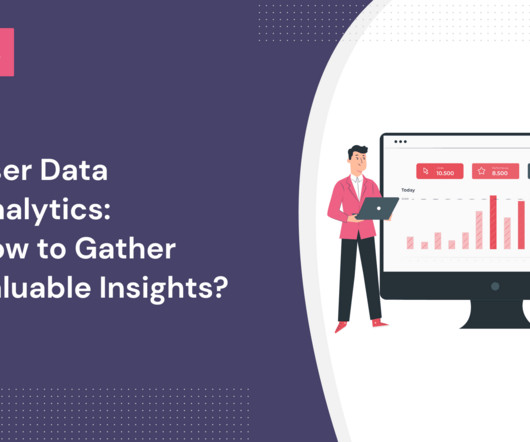
What are user data analytics? From this article, you’re going to find out about different types of user dataanalysis and how to develop a user data analytics strategy that will help your team make data-driven decisions to enhance customer and product experience. User data analytics: trends analysis.
When it comes to product analytics , data is king. Traditionally, SaaS companies had developers define important user actions and add custom tracking code to capture these events. The old way of collecting data, manual tracking , requires developers to manually write code for each event the business wants to track.
I stole some of my comp from the guy who’s putting on this event, Jason. And as I mentioned before, the guy who created the comp plan that I use is the guy who threw this event, Jason. I have a young man on my a sales operations team who wanted to do SQL dataanalysis. Things like recognition, recognizing often.
Here’s a quick rundown of their key tasks: Data Acquisition and Sorting : They help gather information from various sources like sales figures, customer surveys , and in-app behavior. This data often needs cleaning and organizing to ensure it’s accurate and usable. Consider courses on DataCamp or Codecademy.
Manual user tracking requires your continuous effort to collect and monitor user behavior and data, often involving custom tracking codes for each event. In contrast, manual capture is more flexible, creating codes for custom events but slower and prone to mistakes. Auto capture feature in Userpilot.
My favorite R packages for data visualization and munging. -. data wrangling, dataanalysis. The essential data-munging R package when working with data frames. Especially useful for operating on data by categories. data wrangling. Super time saver for messy data. dataanalysis.
Modern analytics tools allow you to track individual and custom events without writing any code. To get the best out of self-service analytics, create a clear analytics plan defining your goals , corresponding success metrics , and data collection methods. Using AI tools will speed up dataanalysis and help you avoid errors.
Looking for an effective event tracking tool and wondering if Mixpanel is the best option for your SaaS company? In this article, we’ll delve into precisely that – helping you determine whether Mixpanel is the ideal choice for your event tracking needs. Looking for a Better Alternative for Event Tracking? Try Userpilot!
What is data-driven analytics in SaaS? How to conduct user dataanalysis? TL;DR Data-driven analytics describes the process of collecting, analyzing , and interpreting customer data to help organizations make better-informed product and strategic business decisions. Path analysis in Userpilot.
For instance, market research data can help you decide on effective product management strategies. Similarly, in-app behavioral data can help you to optimize the user experience, and eventdata can reveal areas of improvement in your conversion funnel. To learn how this can help your business, book a demo today.
TL;DR PostHog autocapture automatically records frontend events on your website or application without manually adding a tracking code for every interaction. PostHog’s autocapture feature tracks general web or in-app events , including page views, page leaves, rage clicks, and mobile screen interactions.
Looking for an effective event tracking tool and wondering if HelpHero is the best option for your SaaS company? In this article, we’ll delve into precisely that – helping you determine whether HelpHero is the ideal choice for your event tracking needs. Looking for a Better Alternative for Event Tracking?
Looking for an effective event tracking tool and wondering if HelpHero is the best option for your SaaS company? In this article, we’ll delve into precisely that – helping you determine whether HelpHero is the ideal choice for your event tracking needs. Looking for a Better Alternative for Event Tracking?
Data literacy : Stresses the need for upskilling employees in data processing and interpretation to drive innovation and better decision-making. If you’re looking to leverage dataanalysis for product management, why not book a Userpilot demo to see how you can start making data-driven decisions?
A reliable data-driven approach… Helps you make the right decisions. Examples of dataanalysis scenarios Qualitative dataanalysis. Quantitative dataanalysis. Sentiment analysis. Examples of dataanalysis methods Dataanalysis methods vary depending on the specific insights you need.
Mixpanel specializes in tracking user events, offering intuitive analytics to understand customer behavior, drive engagement, and support informed decision-making. Zoho Analytics is a business intelligence and analytics platform offering many features to meet diverse dataanalysis requirements. Userpilot pricing.
How to leverage Userpilot for marketing analytics: Track in-app events to understand user behavior and spot high-engagement areas. Now that you’ve understood how to collect marketing data let’s go over ways to analyze it and generate insights. Start tracking in-app events with Userpilot.
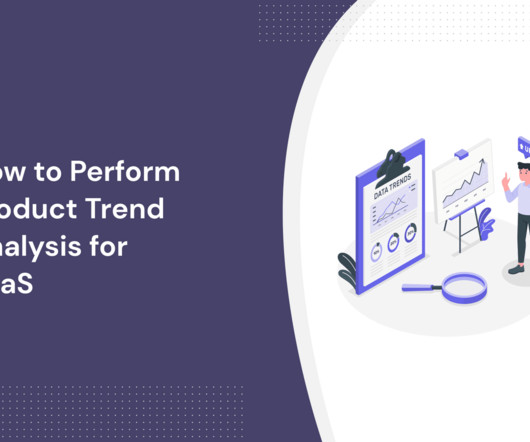
Common features and events to see what functionality is most in demand with your target audience. Product trend analysis is a research methodology used to examine current and historical data to identify patterns, shifts, or developments over time in customer behavior related to your product. Let’s look at what these are.
The truth is, it takes a lot of operational work, dataanalysis, and support skills to make world-class customer service look easy. Join us for our virtual launch event, New at Intercom, on October 12th at 8am PT/4pm BST. So much of delivering an incredible customer experience happens behind the scenes.
Amplitude is one of the best dataanalysis solutions to help you make data-driven decisions and grow your business. Event segmentation analyzes user behavior based on specific events and shows the most commonly performed events. Customer journeys today are multi-stage, multi-channel events.
TL;DR Amplitude’s autocapture automatically tracks user interactions like clicks, page views, and sessions without manual event tagging. Amplitude’s autocapture can track multiple types of events, including clicks on elements, page views, sessions, form interactions, file downloads, and marketing attribution.
Quantitative data is objective, handles large datasets, and enables easy comparisons, providing clear insights and generalized conclusions in various fields. However, quantitative dataanalysis lacks contextual understanding, requires analytical expertise, and is influenced by data collection quality that may affect result validity.
Higher engagement with the insights Repurposing reports into formats more conducive to social media engagement, such as short-form videos, polls, and live events, can lead to higher engagement rates. “We engaged thought leaders and influencers to be a part of the report and the launch event. And for good reason.
We organize all of the trending information in your field so you don't have to. Join 80,000+ users and stay up to date on the latest articles your peers are reading.
You know about us, now we want to get to know you!
Let's personalize your content
Let's get even more personalized
We recognize your account from another site in our network, please click 'Send Email' below to continue with verifying your account and setting a password.


Let's personalize your content