
Why Do Investors Care So Much About LTV:CAC?
To put it simply: higher LTV:CAC → higher margins → higher valuation.
Investors often use 3x LTV:CAC as a rough benchmark of a consumer company’s financial health. If your customer lifetime value (LTV) is 3 or more times your customer acquisition cost (CAC) within 5 years, that means your company has efficient returns on sales and marketing spend. But there’s little discussion of how a higher LTV:CAC actually translates to long-term profitability and, ultimately, valuation.
Solid unit economics has a cascading effect across your business: a higher LTV:CAC ratio means for every dollar of sales and marketing investment, your company has higher margins and so more profit to reinvest back into its business, which means that you can build better products and, hopefully, capture more market demand. Companies are ultimately valued on their future cash flow generation, so the higher your margins, the higher your valuation.
In fact, improving your LTV:CAC from 2x to 3x can nearly triple your valuation.
To illustrate, let’s walk through some calculations using the long-term margin projections across 60+ US public consumer internet companies with extensive sell-side equity analyst coverage.
A few notes before we jump in. For the sake of this post, we consider LTV as your gross profit (as a proxy for contribution profit) from a customer over time and CAC as the total sales and marketing (S&M) spend that goes into acquiring that customer. We generally prefer to calculate using historical monthly customer cohort data for LTV and the CAC associated with that specific month, but there are several ways to calculate LTV:CAC. (Our piece on 16 startup metrics offers more details on how we approach calculating it, while this piece is a great deeper dive into the various considerations that go into an LTV:CAC calculation.)
In our calculations for this piece, we’ve calculated both margins and valuations based on gross profit. Relative to enterprise companies, consumer companies have a wider range of business models (e.g., first-party e-commerce, third-party e-commerce, social networks, subscription-based content, etc.), and thus COGS (cost of goods sold) structures. Focusing on gross profit can help standardize across these differences. As such, S&M, R&D, G&A and operating margins are calculated here by dividing by gross profit, instead of by the more commonly used revenue.
Higher LTV:CAC → higher margins
Let’s start by looking at the inputs into a company’s OpEx (operating expense) lines. Typically, OpEx spend breaks down into 3 buckets: R&D (research and development), G&A (general and administrative), and S&M (sales and marketing). Subtracting OpEx from gross profit is a company’s operating income. In the chart below, we can see that companies with higher gross margins tend to spend more on R&D and G&A when calculated as a percentage of revenue. However, when we adjust those spends to be a percentage of gross profit, they’re much more consistent across company buckets—R&D and G&A margins average around 20% and 14%.
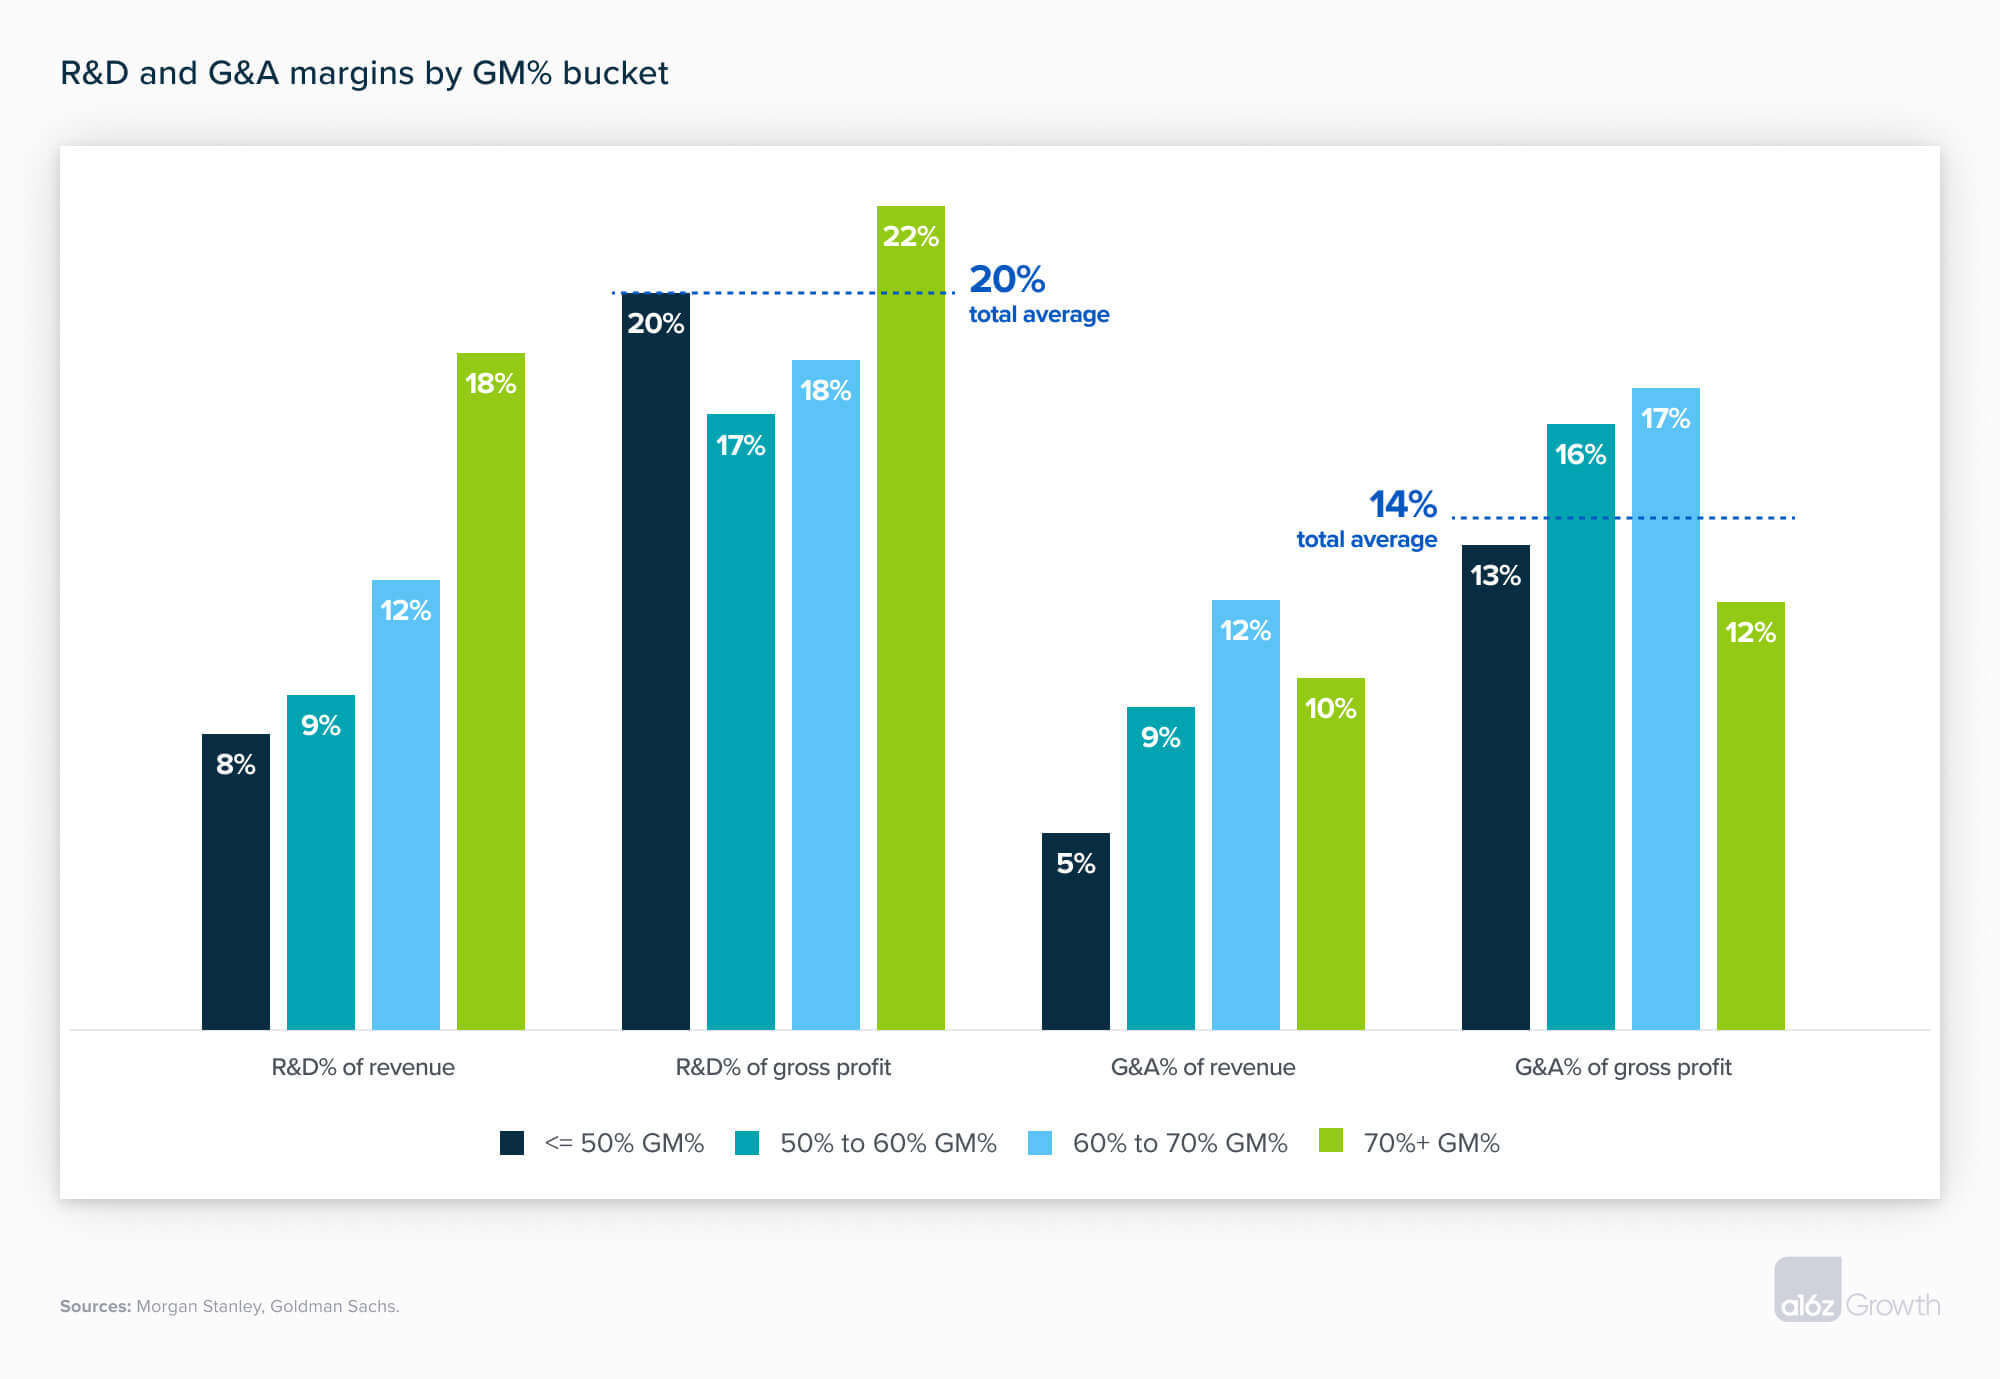
If, as this suggests, R&D and G&A spends as a percentage of gross profit are constant across companies, then your S&M spend as a percentage of gross profit is what drives your long-term operating income as a percentage of gross profit. Your S&M spend is your CAC—the higher your LTV:CAC ratio, the more efficient that spend. In other words, optimizing how you acquire customers has the most impact on how profitable and efficient your company is in the long haul. For companies that have the same gross margins, this relationship between S&M efficiency and a company’s margins can be extended to margins when calculated as a percentage of revenue as well.
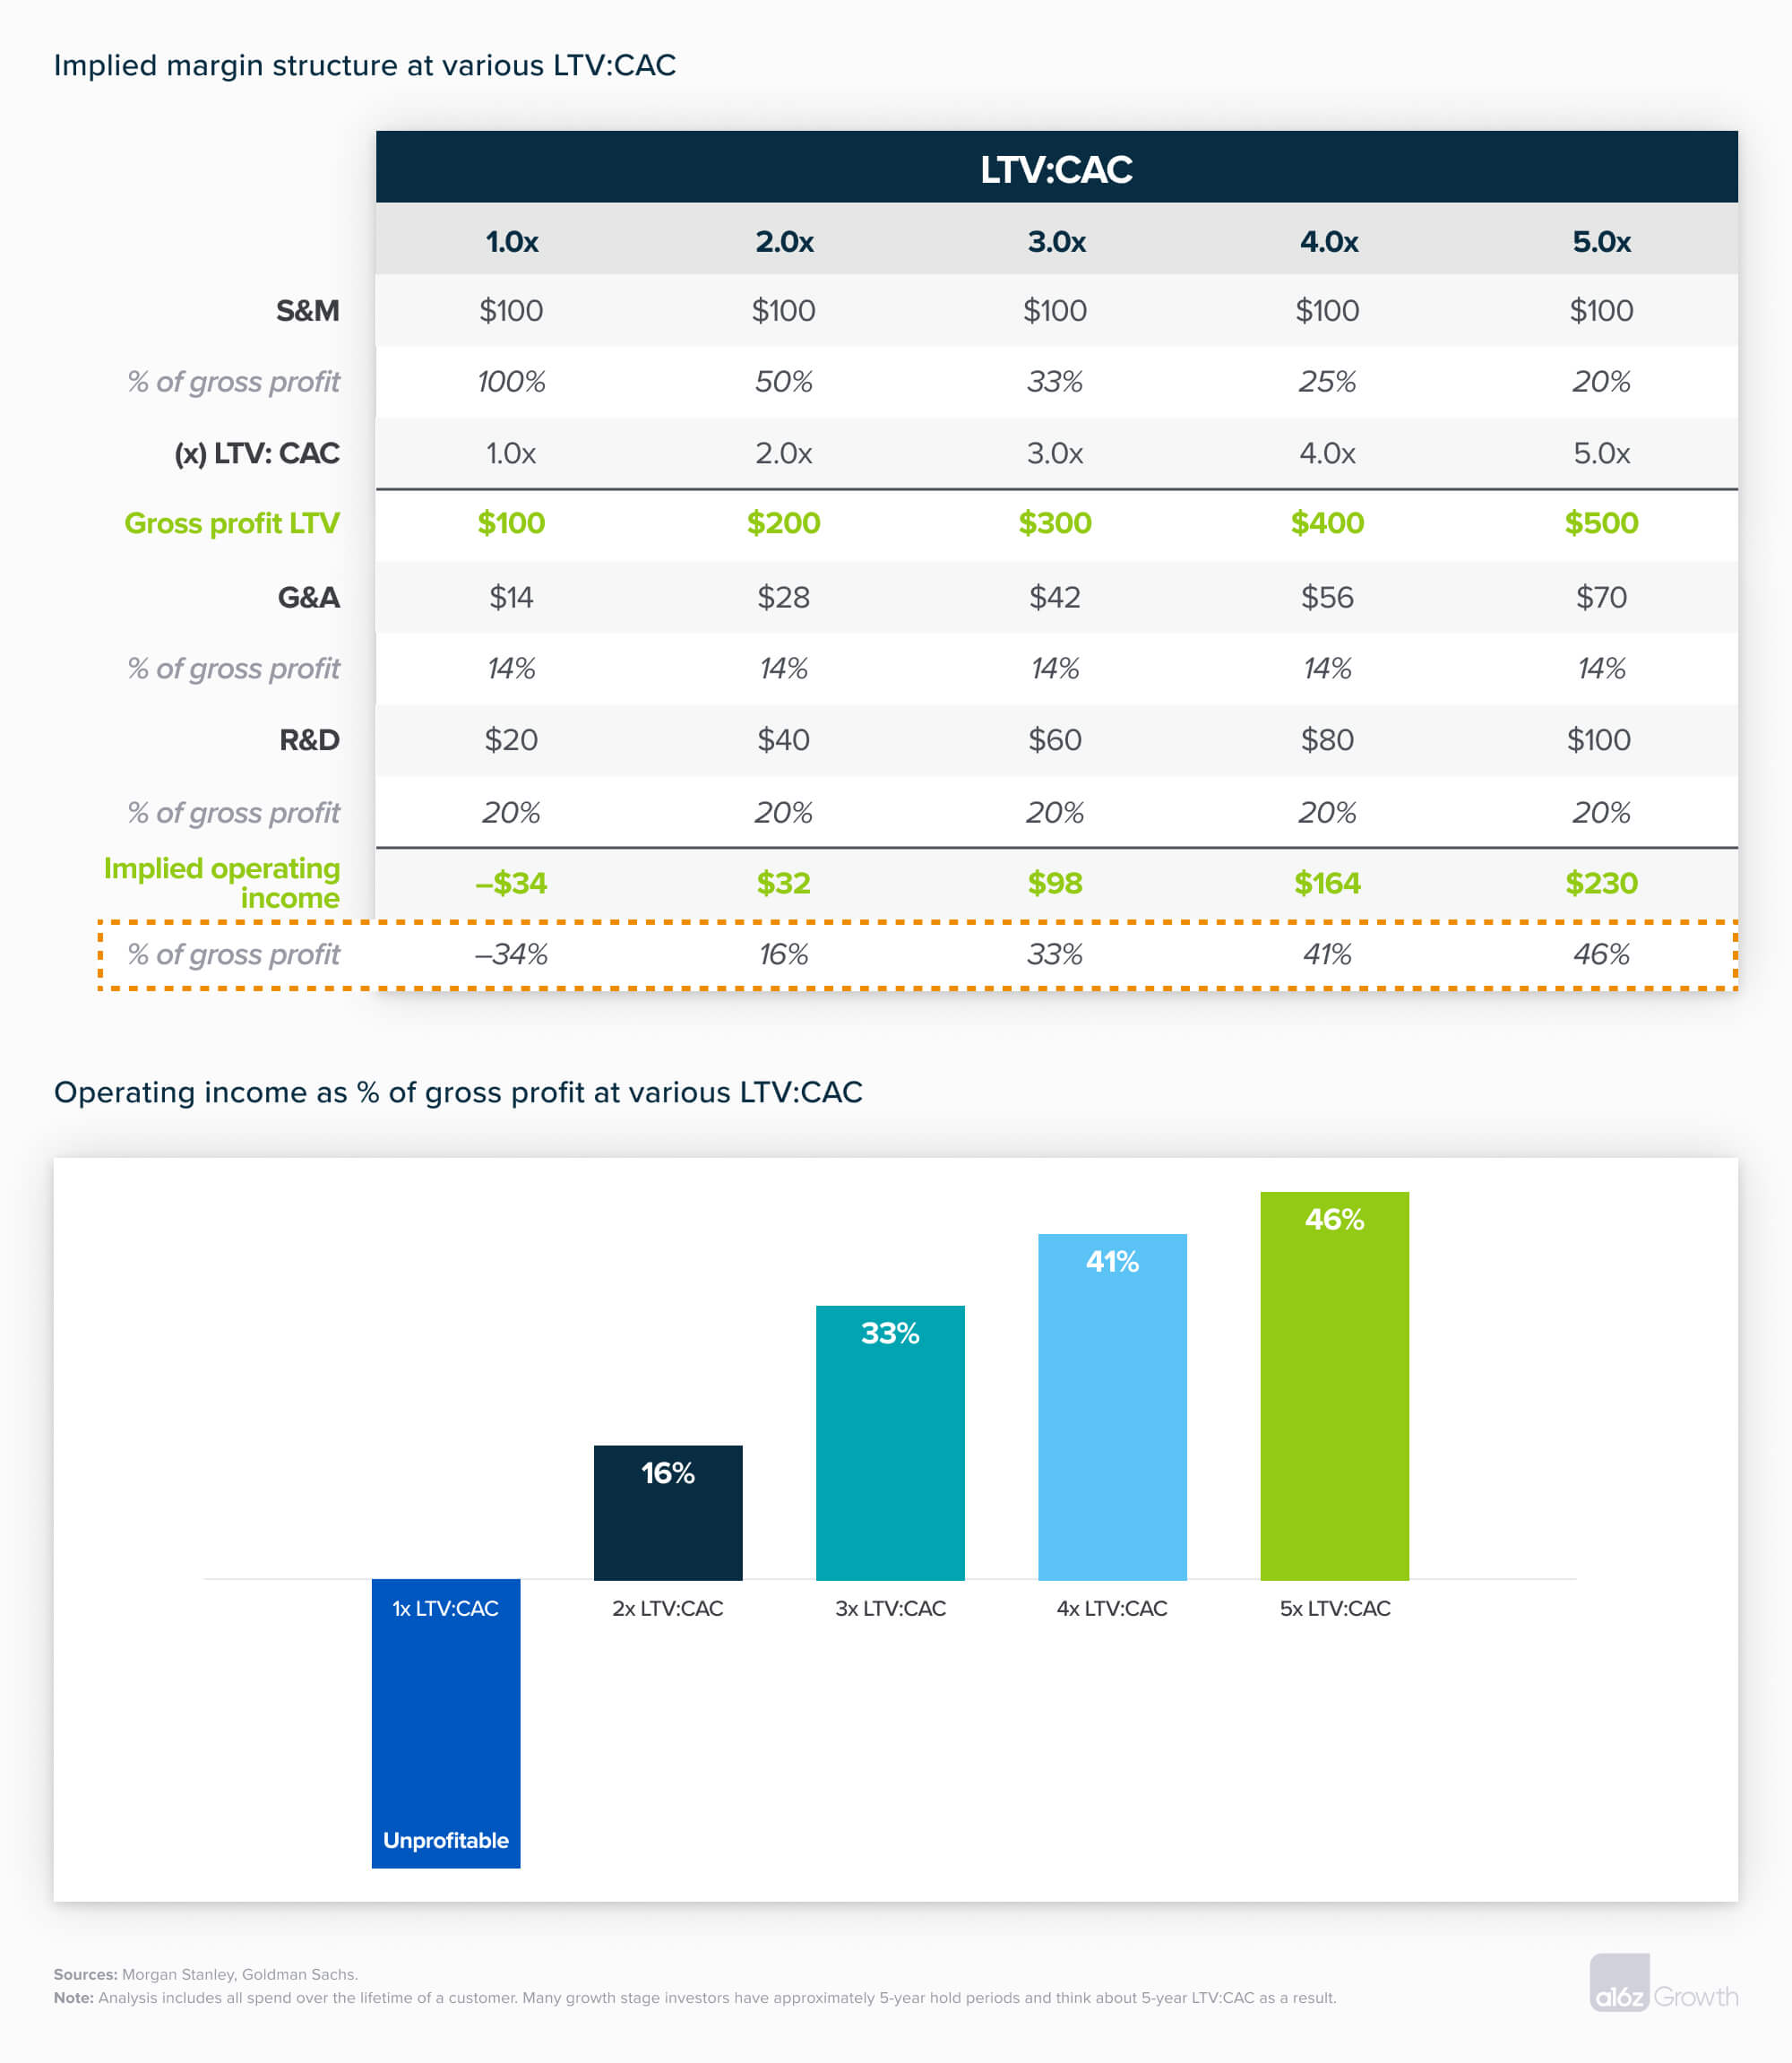
We see this play out in the math below. Using the 20% R&D and 14% G&A of gross profit from above and a hypothetical S&M spend of $100, we can see that companies with higher LTV:CAC ratios have higher operating income and margins. Improving your LTV:CAC from 2x LTV:CAC to 3x, for instance, could improve that from 16% to 33%.
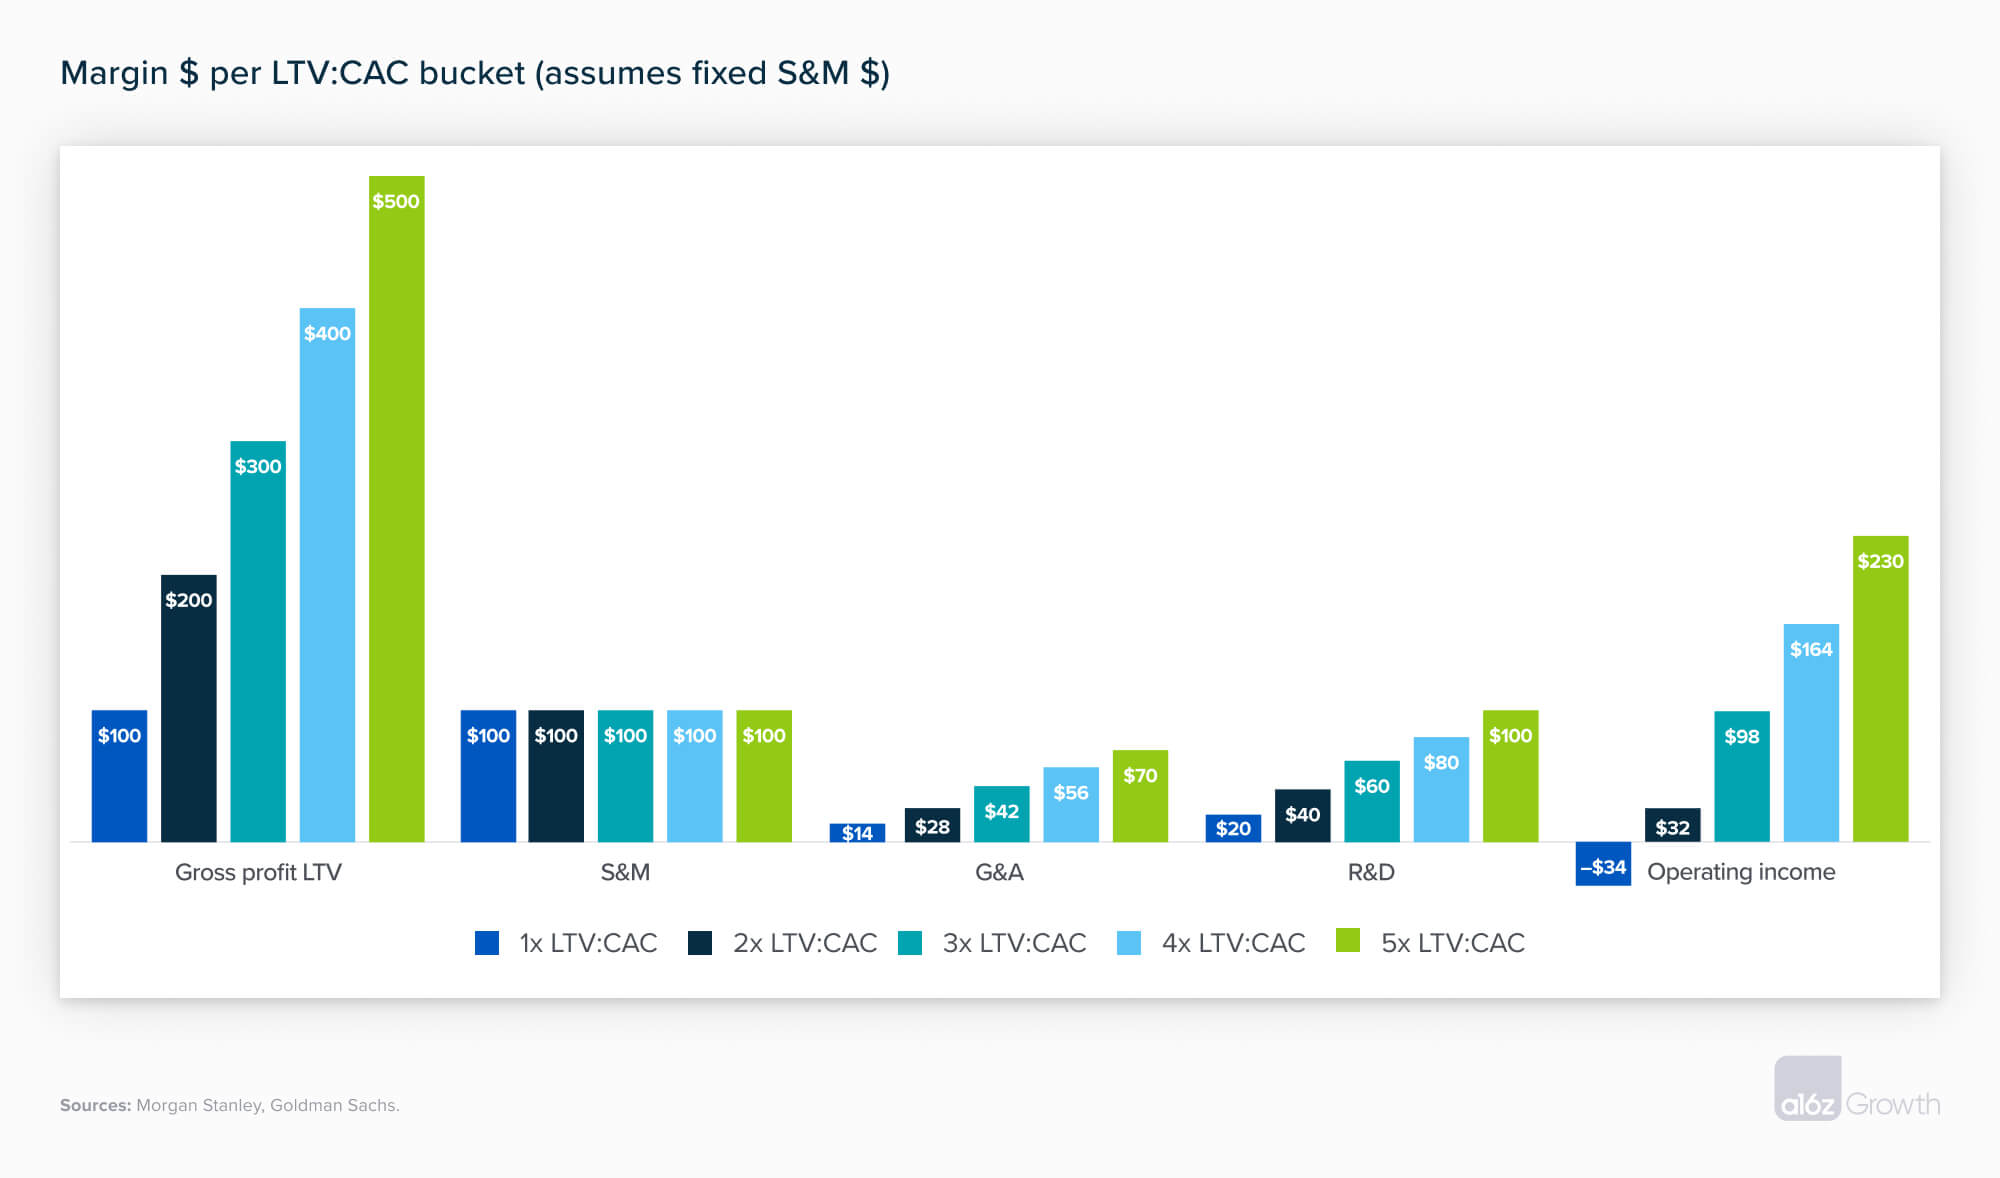
Like we said earlier, higher margins means you can invest more dollars back into your business. For that same $100 S&M spend, higher LTV:CAC ratios lead to more gross profit—which means that those same R&D and G&A as percentages of gross profit equate to more dollars invested in the business. As the graphic below shows, for a $100 of CAC spend, $68 is invested into R&D and G&A for a 2x LTV:CAC business, $102 for a 3x business, and $170 for a 5x business.
Higher margins → higher valuation multiple
A company’s value is the net present value of its future cash flows. More profitable companies are more valuable because they can generate more profit for each dollar earned. This means that the higher your margins, the higher your valuation. It’s worth noting that investors also consider growth when calculating a company’s valuation multiple. The 2023 market has thus far rewarded margins over growth, but both are important contributors.
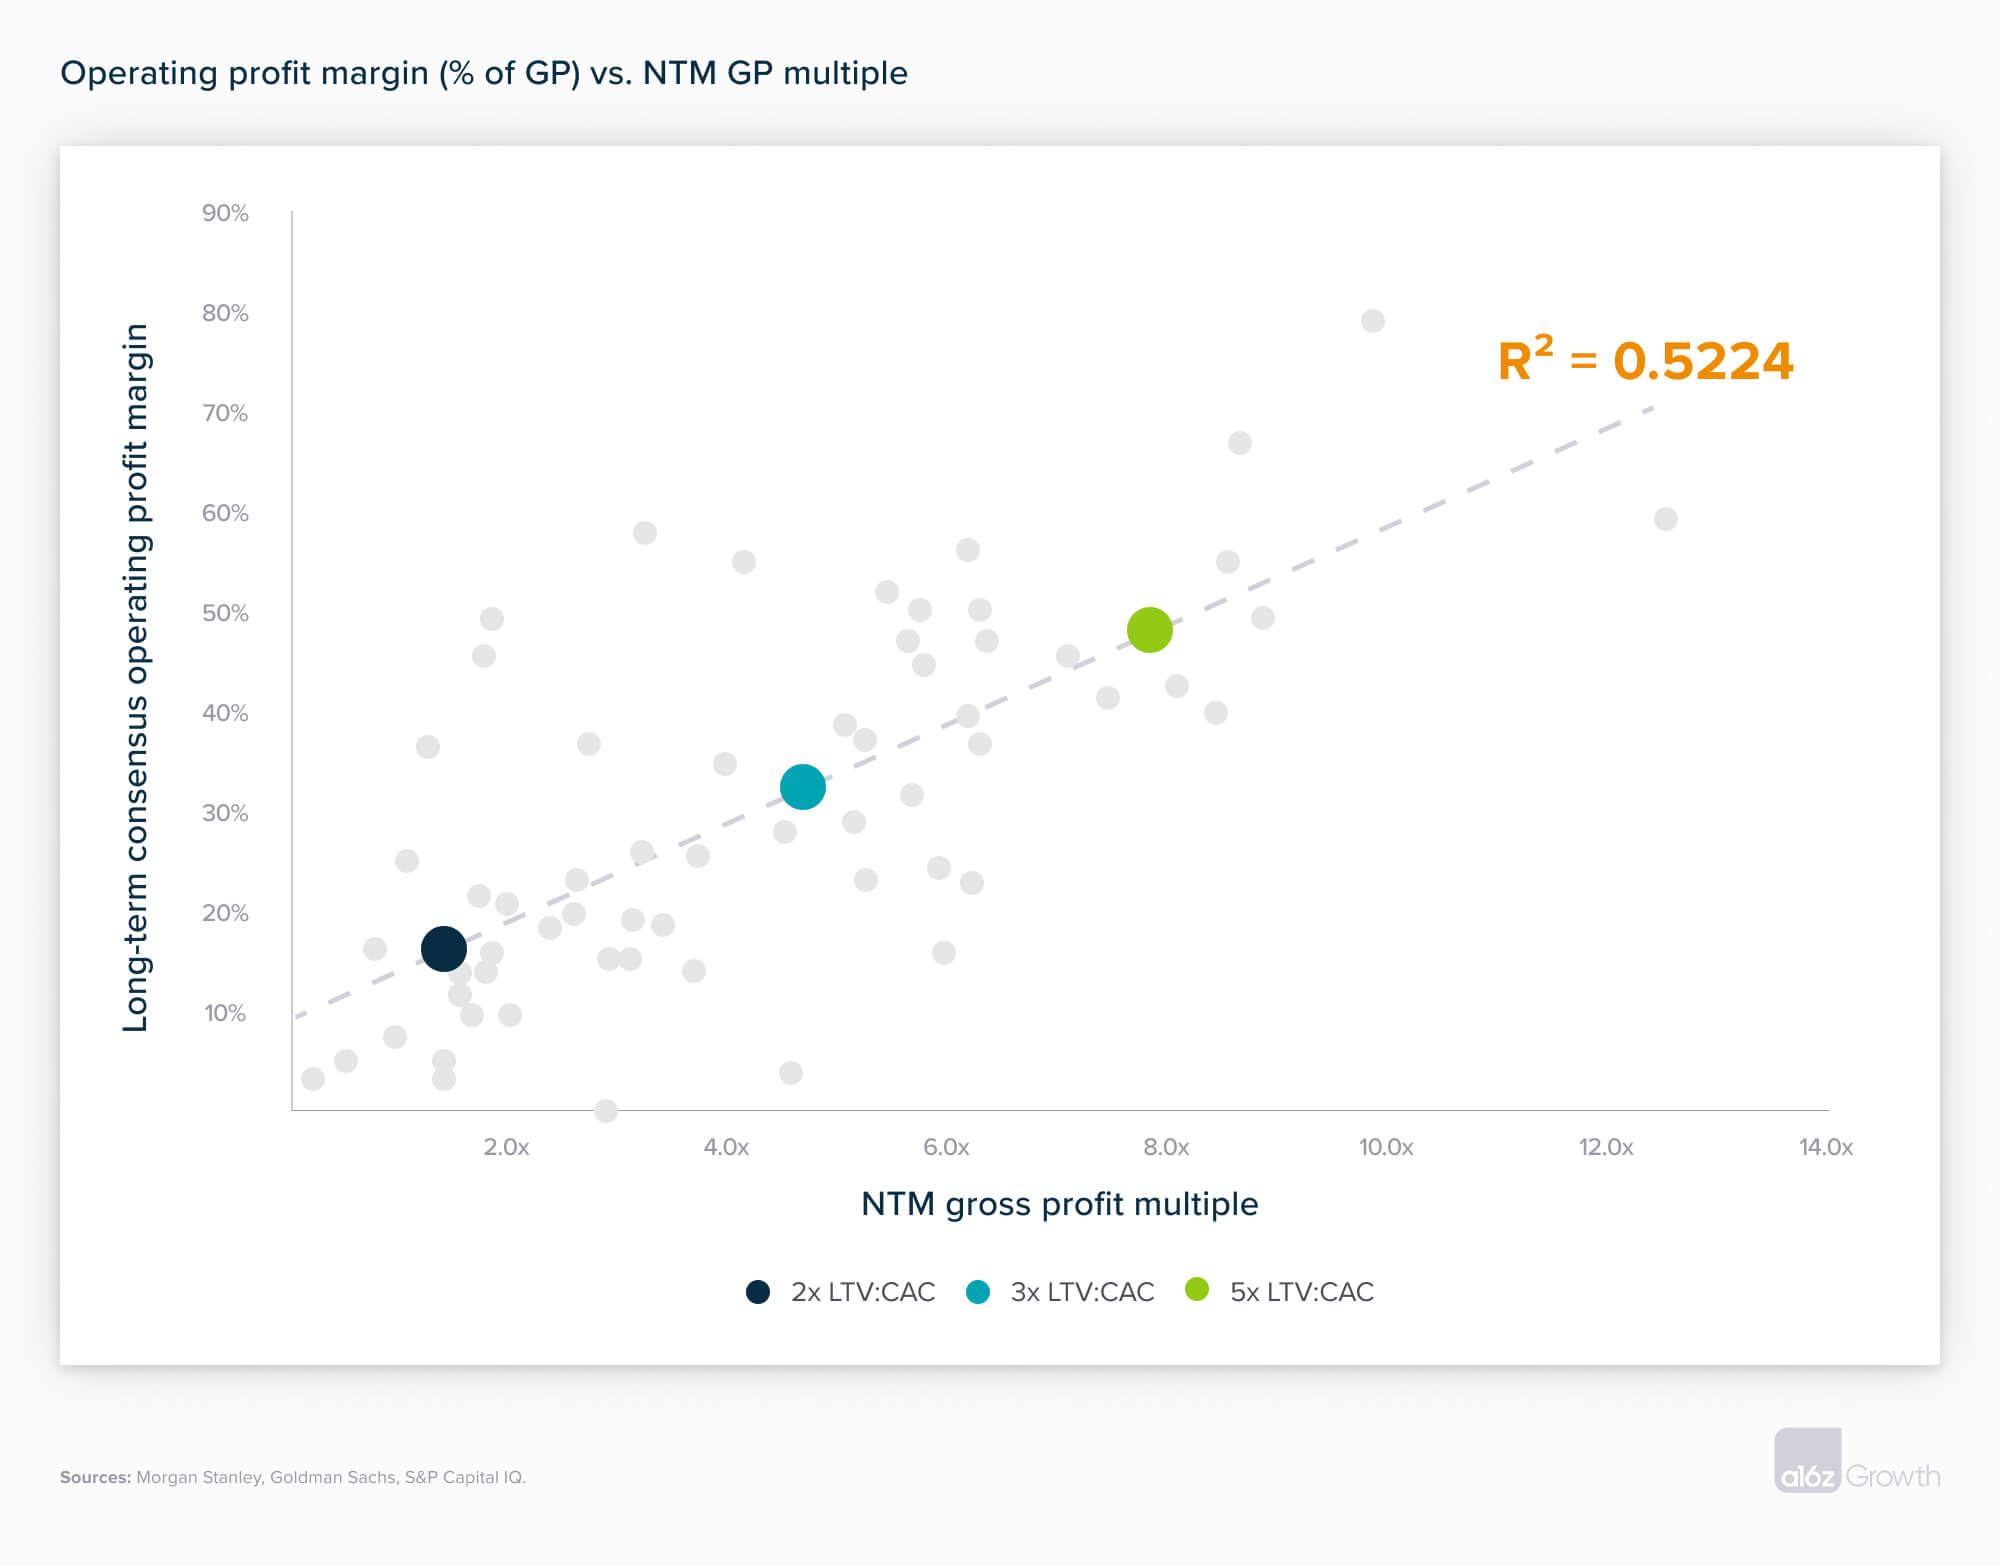
When we look at the relationship between long-term margins and gross profit multiple, we find that consumer internet public companies with ~16% margins (the above derived margin in our 2x LTV:CAC example) trade at ~1.5x forward gross profit. Companies with 33% long-term margins (our derived margin for 3x LTV:CAC) trade for ~5.3x, and companies with 46% margins (5x LTV:CAC) trade for ~8.4x. So for a given amount of gross profit dollars, our 3x LTV:CAC business is worth more than 3 times our 2x LTV:CAC business, and our 5x LTV:CAC business is worth more than 5 times!
In short, there’s a good reason why LTV:CAC is a key metric of best-in-class consumer internet companies. For more on metrics and benchmarks for B2B companies, check out our Guide to Growth Metrics.


- Pricing and Packaging Your B2B or Prosumer Generative AI Feature
- 2024 Big Ideas: Voice-First Apps, AI Moats, Never-Ending Games, and Anime Takes Off
- Let’s Get Personal: Why AI Will Unlock a Massive Market for Online Consumer Services
- AI, Efficiency, and All Things Fintech in 2023: A Q&A with the CEOs of Adyen, SoFi, and Wise
- The 2022 Effect: A Benchmarking Bulletin