Are You Ready to Be a Public Company?
The real checklist: credible growth story + operating leverage + accurate forecasting
Going public is not the same as being a public company. When you go public, your company’s performance suddenly has a real-time scoreboard: your stock price. It’s easy to think that high growth can make up for a low stock price, especially for founders at fast-growing late-stage startups that are still burning cash. But as a public company, the reality is that a low or volatile stock price sucks and can hurt your business. It’s bad for employee morale and retention, it’s bad for recruiting and hiring new executives, it’s bad for using your stock for M&A, and it often gives competitors the opening to point at your stock price and say, “the market’s figured it out. They’re a disaster.”
This doesn’t mean a company has to wait until they’re profitable to go public. However, if you are still burning cash as a public company, you need to know how to give shareholders what they need to build a high-confidence model of your business—and seemingly small differences in investor assumptions about your company can result in big impacts on your stock price. Here’s my framework for growth-stage companies that are burning cash and want to know: “am I ready to be a public company?”
- Do you have a credible growth story to sustain 20%+ growth in year 6 of your financial model?
- Do you have the operating leverage and stock burn (annual dilution) public investors expect?
- Can you accurately forecast your business within +/-10% 4 quarters out—and meet or beat it?
Do you have a credible growth story?
Are you sustaining 20%+ growth in year 6 of your financial model? And can you tell a compelling story about what will drive that growth?
As a public company, your stock value depends on your ability to show investors that you have a credible path to grow—especially if you’re not cash flow positive yet. Investors build models over 5–10 years, so as a general rule of thumb, you want your financial model to show that you can sustain 20%+ growth in year 6 if you’re currently burning cash. Otherwise, your combination of growth and profitability is unlikely to get public investors excited. (As a note: while I draw a line in the sand at 20%+ growth in year 6 for high-growth companies, there are plenty of successful, highly valued, more mature companies in the public markets with lower growth and higher profitability.)
But it’s not enough to show some possible scenario where your numbers translate into growing 20%+ in year 6. You need to show that scenario is credible and likely, and that means telling a compelling story about why you’ll keep growing really fast for years to come—by selling additional products or selling your existing product in more places, or both.
The most powerful growth stories prompt investors to dream about what would happen if your company figures out the next product, and the next product after that, and then becomes an industry platform with stickiness and staying power. After all, what is the open-ended upside of the company that started out selling CRM software that then turned into Salesforce with over 6 different products? Those are the stories on which generation-defining companies are made.
You know best what drives your business. If you want investors to understand your business the way you do, share the data that helps them build a model the same way you do. To make this more concrete, here are a few companies I think have told compelling growth stories.
Crowdstrike: product→platform
A platform is a company that has a defensible core product with lasting customer relationships, and something about that core product that gives them the right to win incremental new business from the customer at a lower cost of acquisition than competitors. If you tell investors you’re a platform, the numbers better back the story up. In Crowdstrike’s case, it did.
They told investors they sold a broad security platform with products that spanned endpoint security, IT operations, and threat intelligence. In their S-1, they cited that 47% of their customers (and growing) bought 4 or more of their products, which had increased net dollar retention from 127% to 147%. Customer testimonials backed up the numbers, showing that major enterprises viewed CrowdStrike as a security platform, not just a product.
“CrowdStrike Falcon provides us with the protection as well as a level of functionality and visibility we didn’t find from other providers.”
—Deputy CISO, AWS
“In my career, the deployment of the CrowdStrike Falcon platform was perhaps the easiest global security rollout I’ve seen.”
—CSO, ADP
Generally, a company needs to show a base level of execution selling multiple products before investors will give you credit for it. In CrowdStrike’s case, they had historically proven that they could cross-sell products, and investors could easily see customers were willing to buy additional products and bake that assumption into their models.
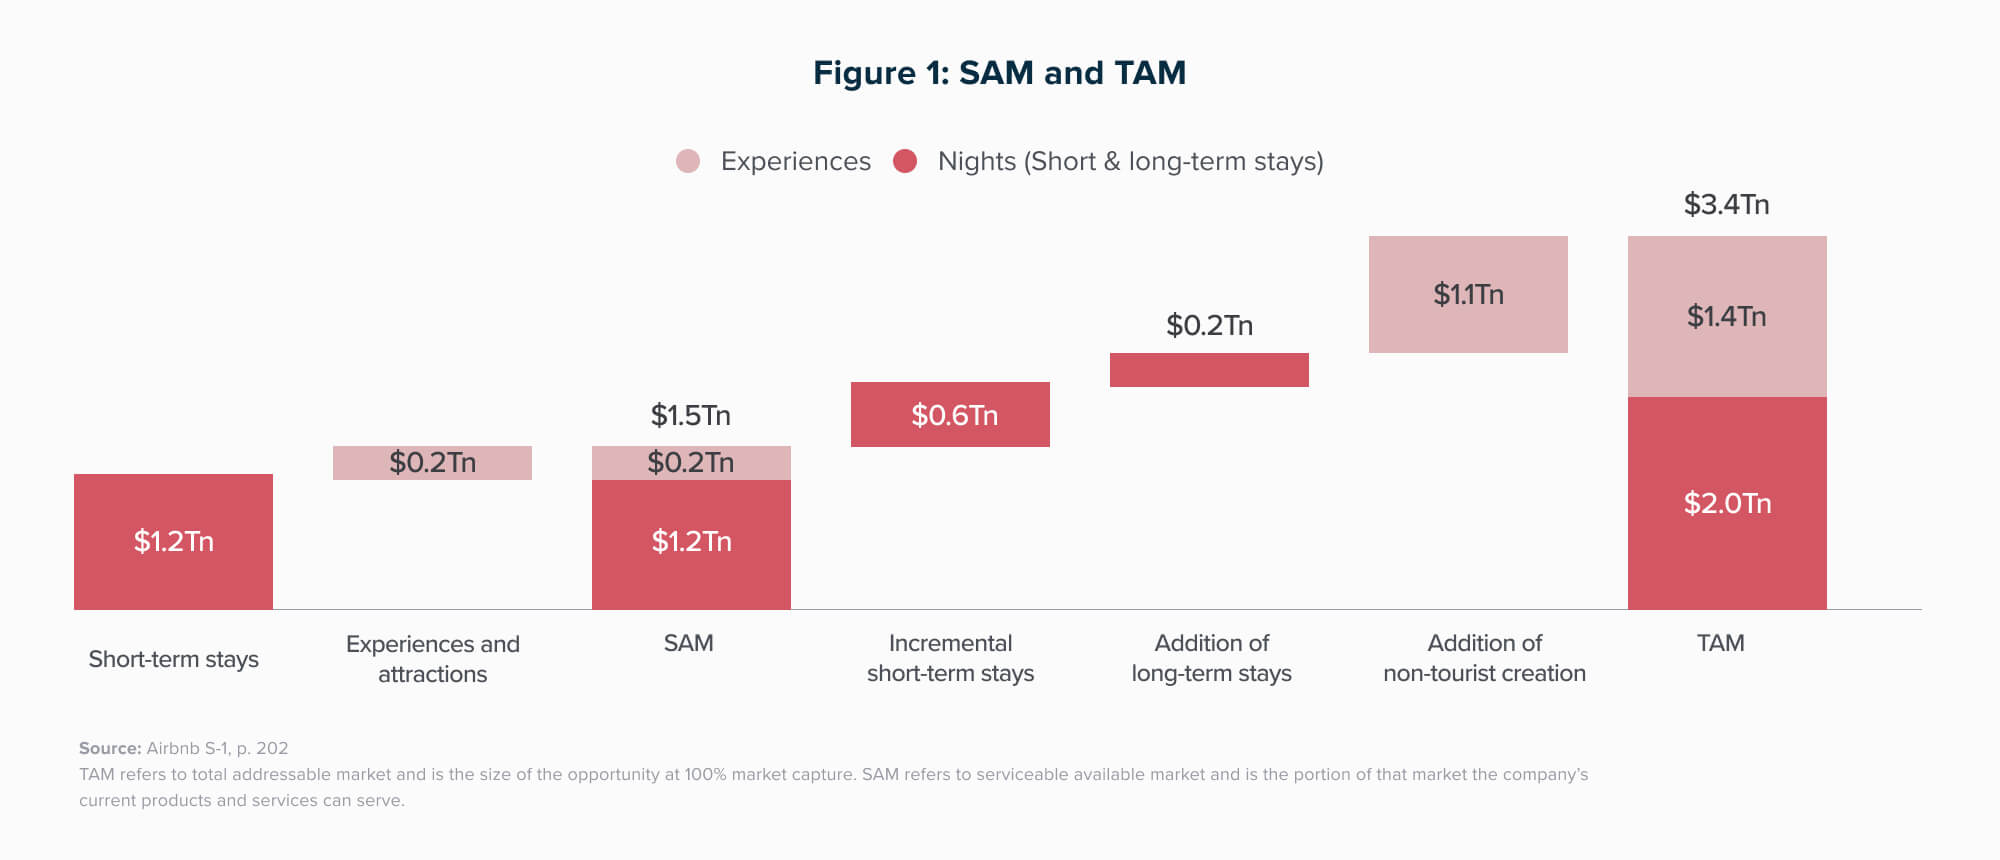
Airbnb: network effects
As a 2-sided marketplace, Airbnb initially found product-market fit with budget-conscious travelers who wanted cheaper alternatives to pricey hotels that were better quality or offered more privacy than 12-bed hostels. As their core product improved over time, network effects kicked in, and Airbnb expanded their TAM to include higher-end travel, international travel, and business travel. The more people used Airbnb, the more people listed accommodations on it. The more accommodations that were listed, the more people used Airbnb. A pretty compelling story for sustained growth! And in Airbnb’s case, they also had a compelling second product line—Experiences—to fuel growth in addition to network effects.
Nubank: communicating the growth model to investors
The Brazilian-based fintech company Nubank started with a set of highly engaged users in a large market category (credit cards and personal finance), as shown by a high ratio of DAUs to MAUs—almost 50%. As those customers grew their wealth, Nubank demonstrated strong cohort retention and an ability to sell additional products beyond their entry-level credit card to those same customers. In other words, they had plenty of new customers still to win with low overall penetration of their TAM in their core market, and a proven ability to expand relationships with existing customers. They added to that early success expanding into new geographies, proving that their playbook worked in other markets, and a roadmap for a product line focused on small businesses. This all added up to a compelling story that gave investors clear, logical building blocks for a credible long-term growth model.
Do you have the operating leverage public investors expect?
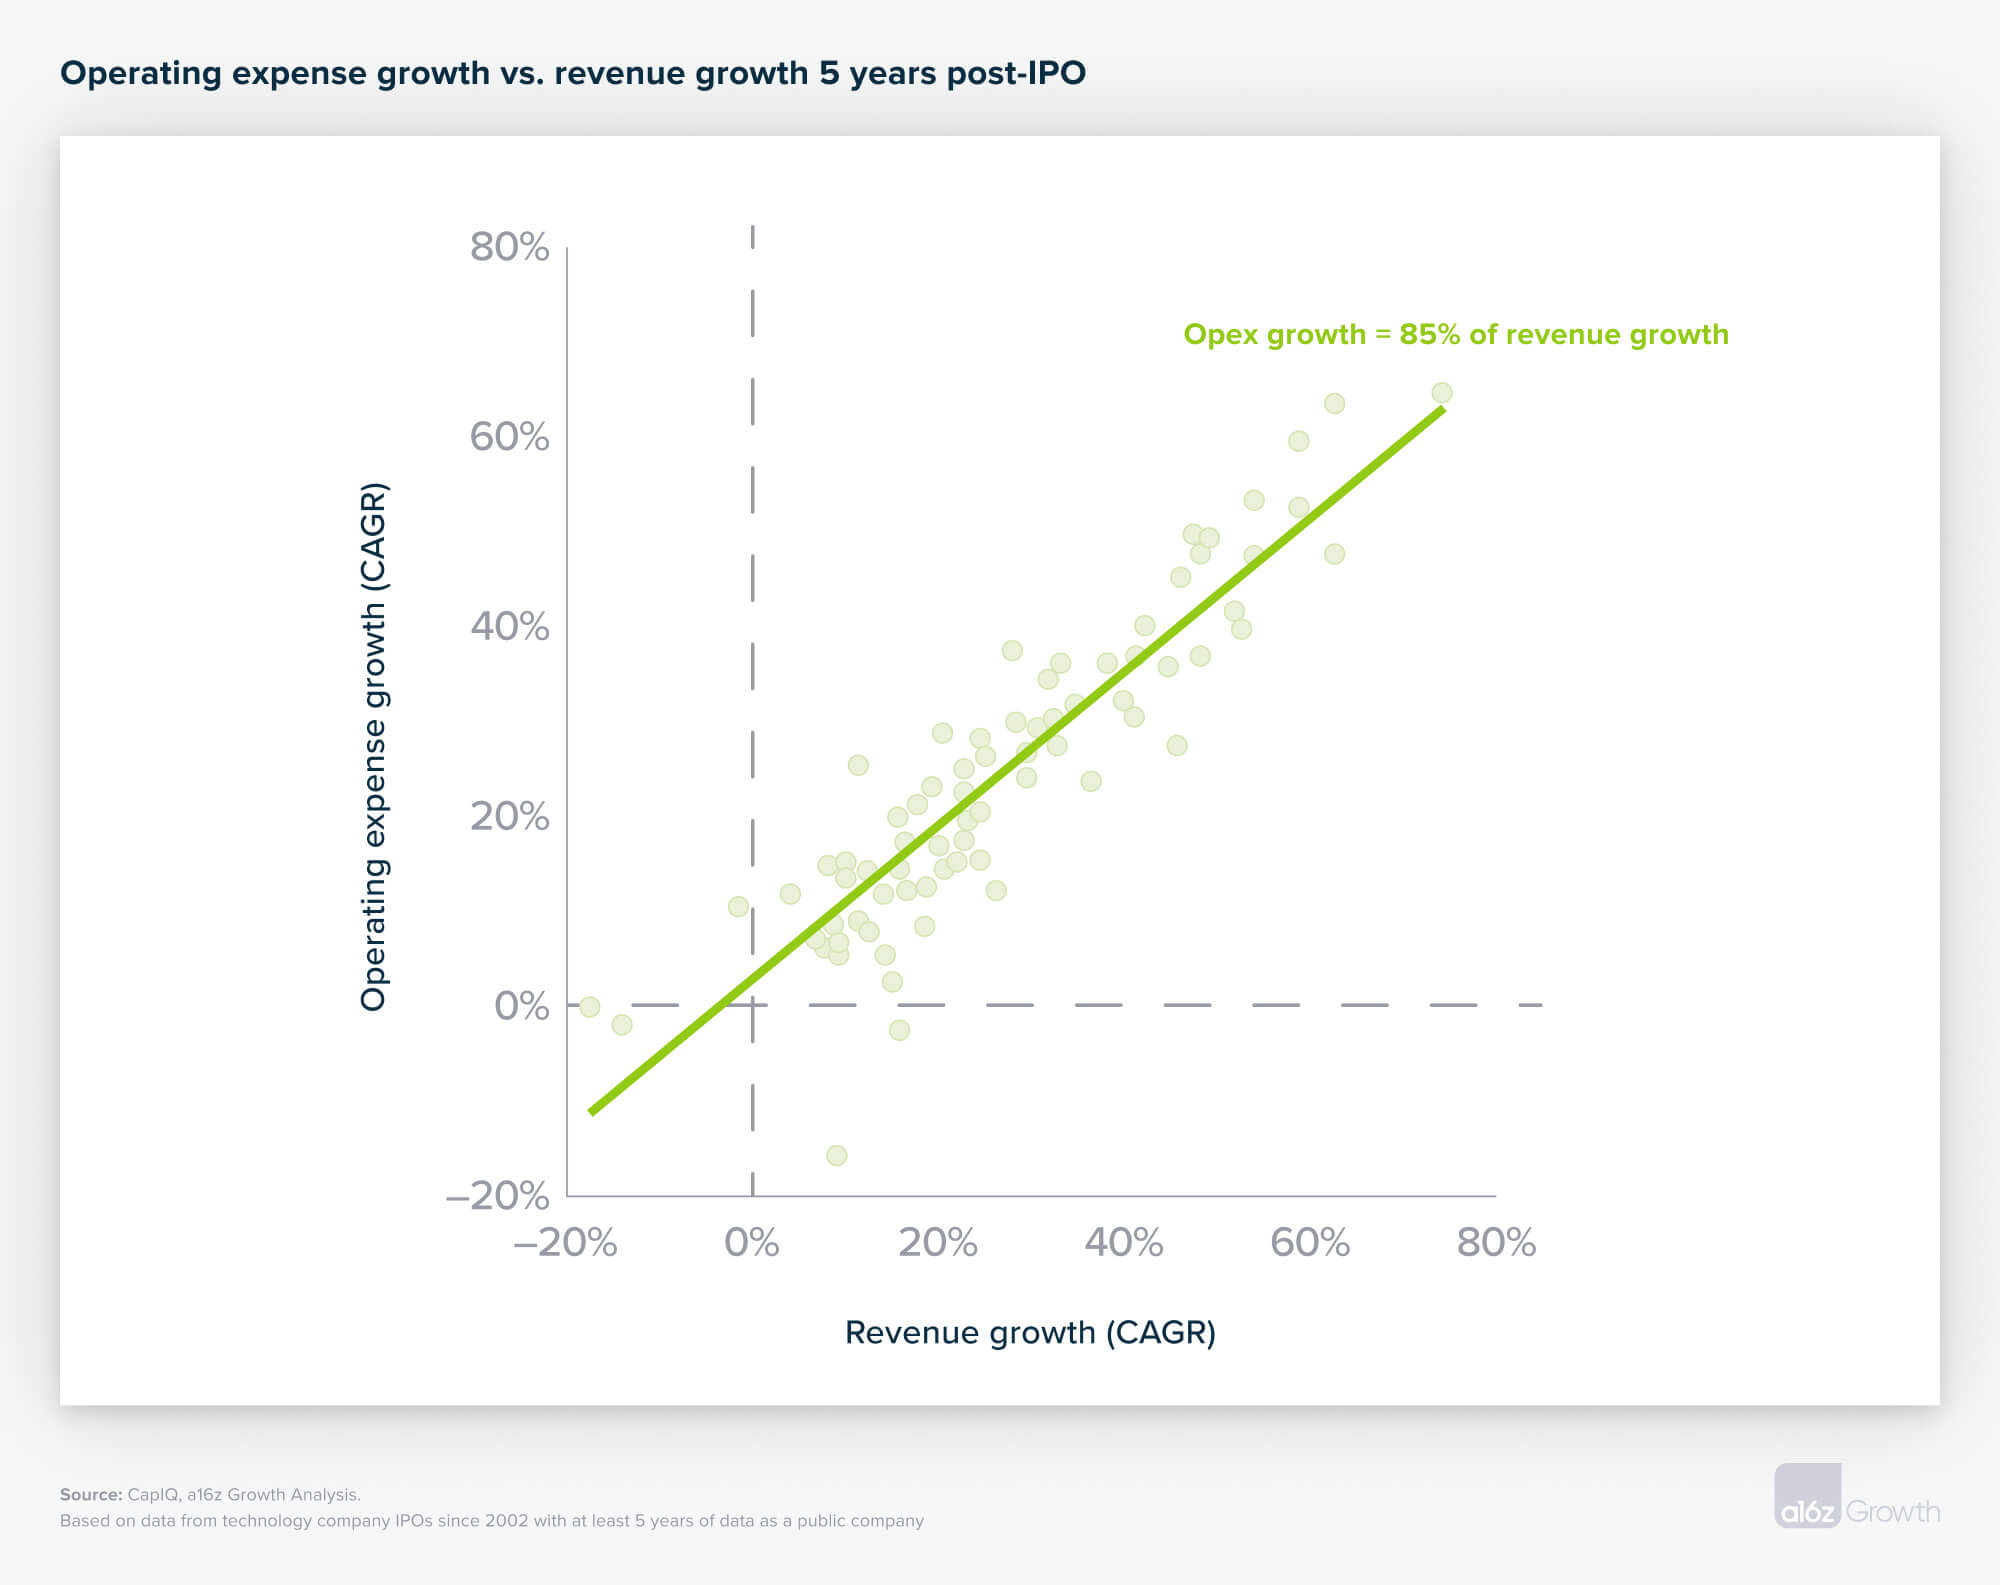
Can you grow expenses at 85%, or lower, of the rate at which you grow revenue and keep annual stock burn at 2–3%?
Investors want to build a model where they’re confident that as you scale, your costs won’t grow as fast as revenue, so your margin improves. That’s operating leverage.
One rule of thumb for assessing operating leverage as a public company: am I growing expenses at 85%, or lower, the rate at which I’m growing my revenue? For a company growing 50% at IPO, if you grow expenses at 85% of your revenue growth, your margins will have improved by 22% points over the course of 5 years. There is very strong clustering around this 85% ratio among public companies, which we suspect is driven by investors expecting a certain amount of operating leverage and public CFOs who know what numbers “the street” expects. (It turns out public companies don’t do zero-based budgeting after all.)
Another part of establishing operating leverage and cost discipline as a public company is keeping your stock-based comp at the burn levels (annual dilution) public investors expect. Stock-based comp is often a substitute for cash-based comp, so if you have an 85% ratio of expense to revenue growth but are issuing massive amounts of employee stock, then you aren’t really at 85%. Investors might not care about this as much when the market is good because they expect stocks to go up. But when the market is tough, investors tend to pay a lot of attention to stock burn. Best-in-class public tech companies have 2–3% annual stock burn (in the form of RSUs), which is lower burn than most private tech startups are used to. If you’re considering going public, it’s a good idea to start paying attention to, and if possible lowering, your stock burn while you’re still a private company.
Can you accurately forecast your business?
Can you accurately forecast your business within +/–10% 4 quarters out? And can you beat guidance by 4–6% each quarter?
You have to hit your short-term targets to get credit for your long-term growth plans and margin aspirations. Public investors have been conditioned to expect you to beat and raise your financial guidance consistently every quarter. Missing big within the first few quarters can be devastating—not because your business is broken if you miss, but because your stock price will suffer as public investors question your forecasts.
Consistently and accurately forecasting your business is hard, and most companies need to be pretty large before they can consistently predict revenue, future growth, and operating margins. For this reason, we recommend companies do mock “public” guidance and earnings calls for the 12–18 months before going public.
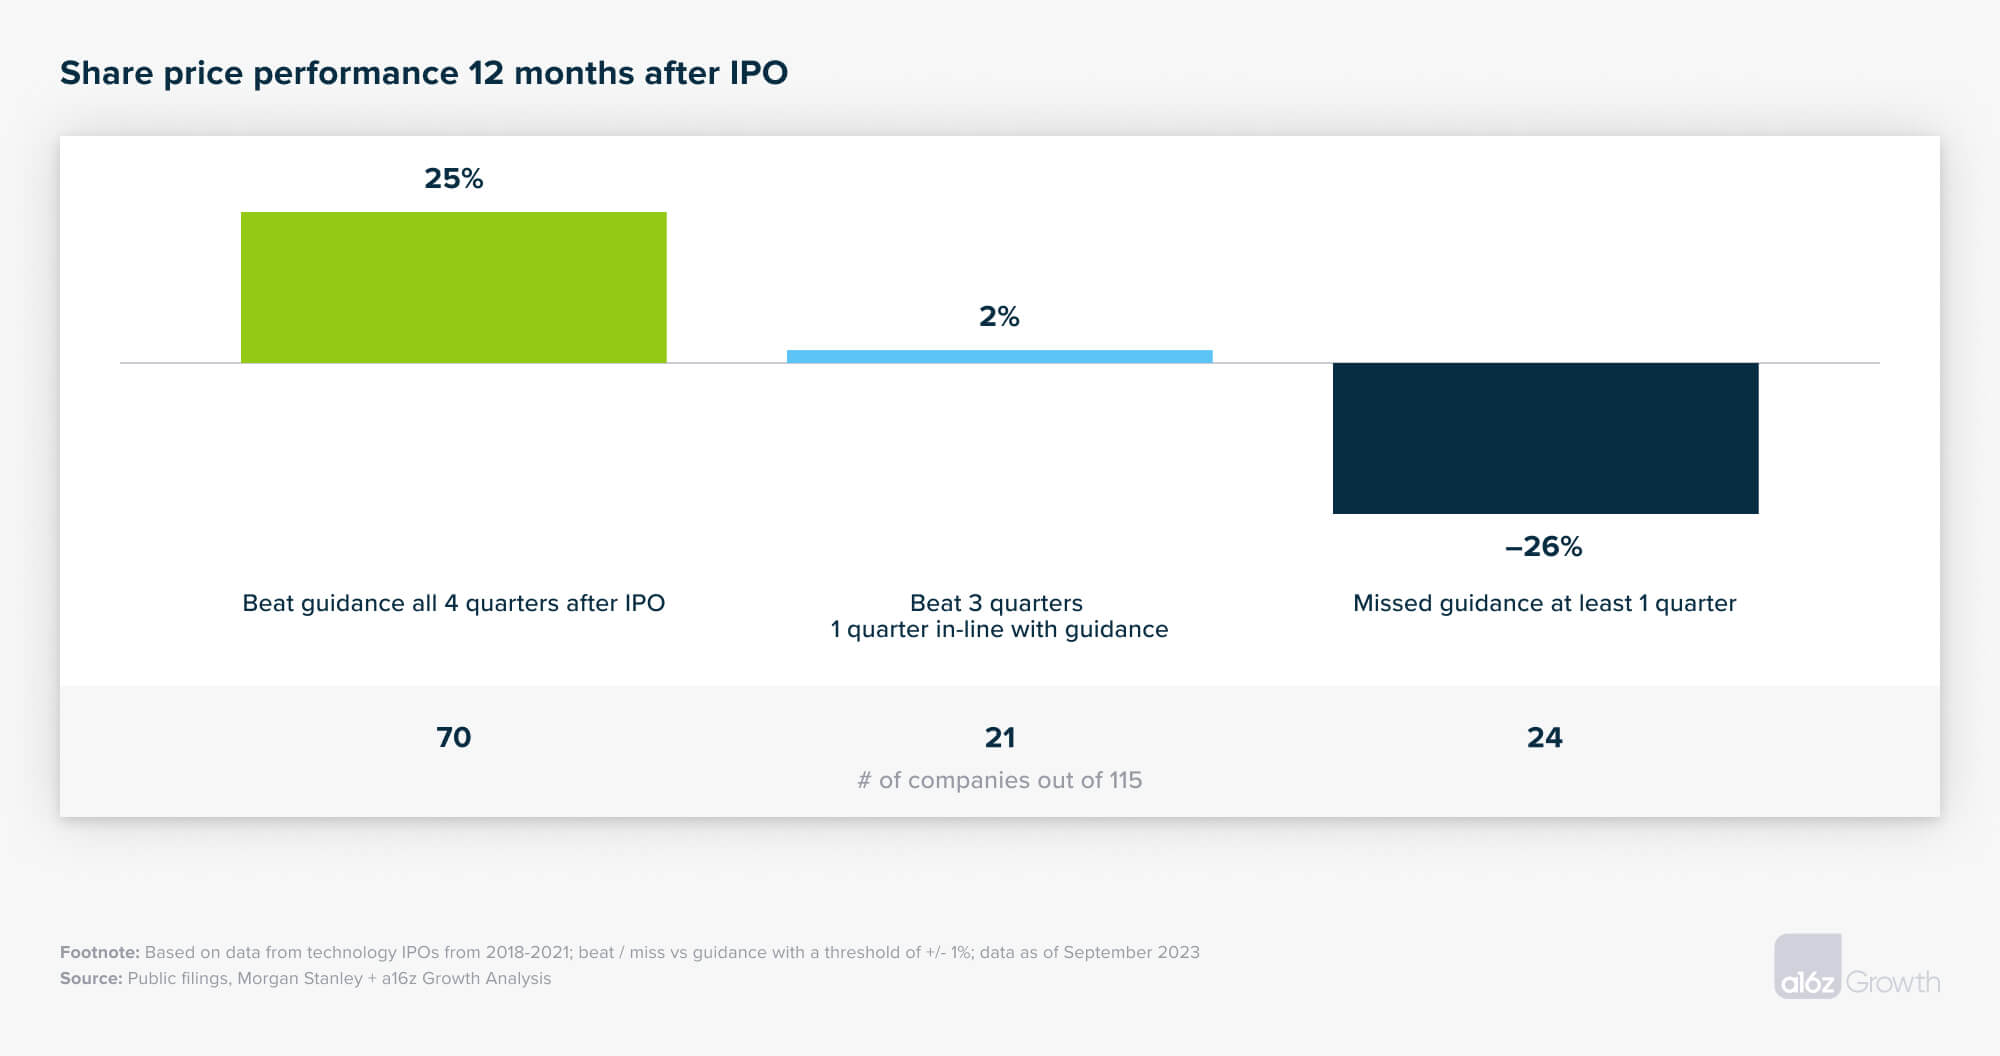
On average, when we looked at the performance of 115 tech companies that went public in the last 5 years, the best performing companies beat their quarterly guidance by 4–6% in the first 4 quarters after they IPO’d. We counsel our companies to set guidance that you can beat by 4–6% and then build in a buffer on top, since missing can really damage investor confidence and, consequently, your stock price. And as we’ve established, a low stock price sucks.
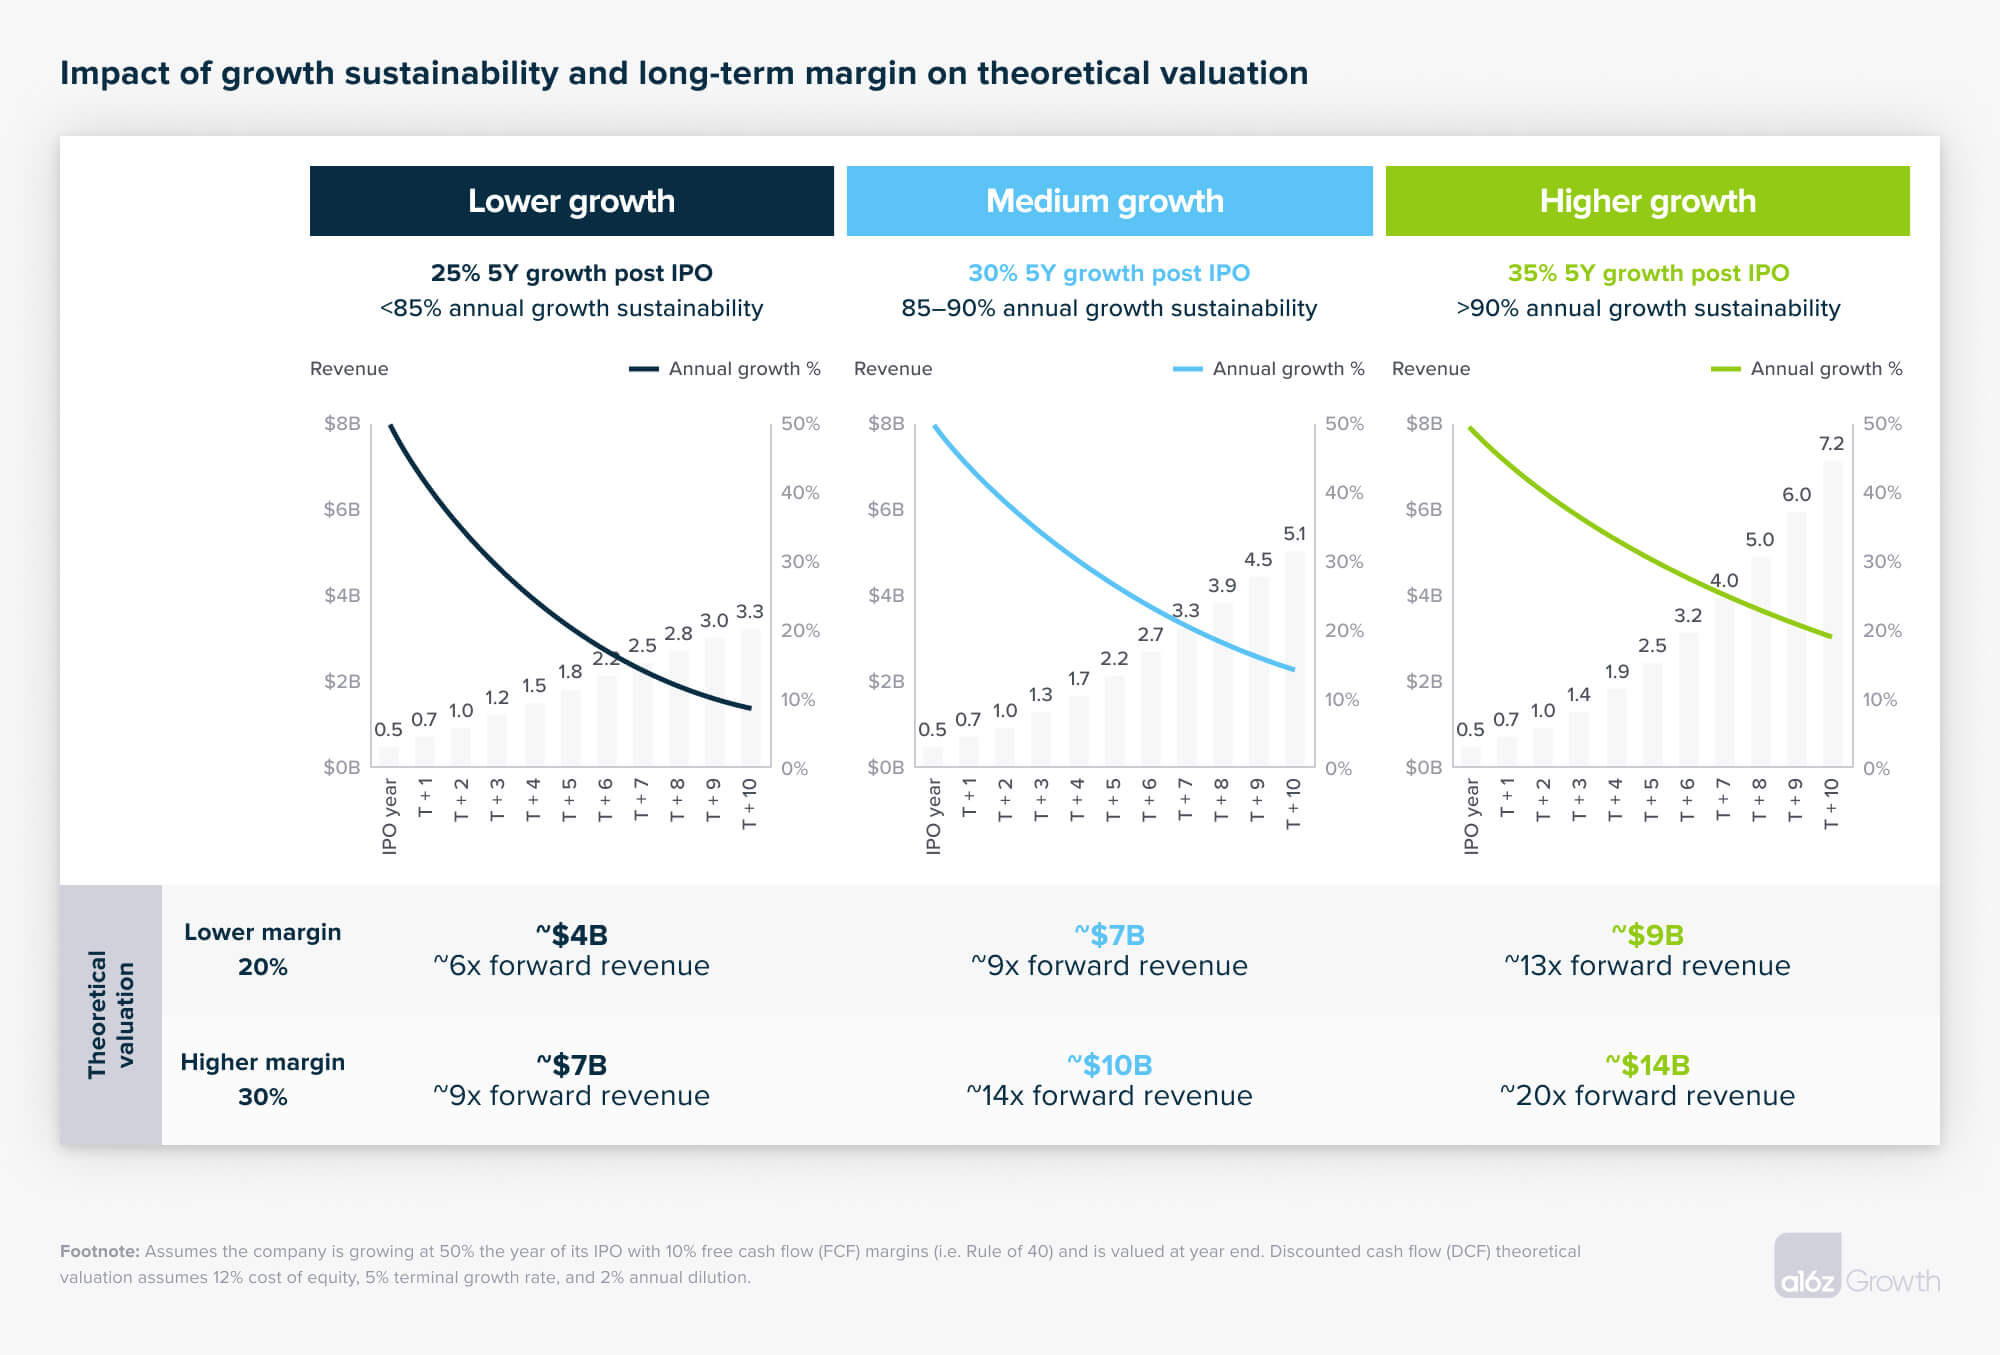
When investors build valuation models, seemingly small differences in their assumptions about your topline growth and margins can have a huge impact on their buy price and, thus, your stock price. At a simplified level, your company is valued as the sum of your future cash flows. Higher topline growth rates combined with higher free cash flow margins at maturity lead to materially different cash flow profiles and, consequently, stock prices.
In the chart above, we show the financial impact of growing at a rate of 25%, 30%, and 35% in the 5 years after IPO—and clearly, higher growth rates compound over time to make a big difference in revenue profiles! If investors also assume a high-growth company has increasingly better margins, the difference in free cash flow generation is even greater—in some cases, great enough to be the difference between public investors valuing you at single- or double-digit revenue multiples. For instance, in the hypothetical examples in the graph above, a company growing at 35% for the first 5 years as a public company with a path to high long-term margins is valued more than 3x higher at IPO than a company growing 25% with lower steady state margins ($14B valued at 20x forward revenue vs. $4B valued at 6x forward revenue). This is the huge effect growth and margin assumptions can have on your valuation at IPO.
All of this is to say: if you’re a growth-stage company considering going public, start practicing being public—which means telling the story of how you’ll continue to grow, establishing operating leverage, and accurately forecasting where you’re going.
Special thanks to Justin Kahl and Santiago Rodriguez for their contributions and feedback on this piece.