
Beyond Sales: Understanding my Subscriber Profitability through Lifetime-Value and Retention Metrics

Moving from ROAS to LTV/CAC
The move of DTC eCommerce from once-through purchases to subscriptions requires a new set of metrics to evaluate customer experience. The traditional model of looking at advertising and marketing spend is to measure campaigns in terms of “Return on Ad Spend” (ROAS), where the cost of the ad is balanced against the revenue from a session connected to the ad.
There are several problems to this approach, but the most important is that a simple ROAS calculation misses customer satisfaction with the product and experience, especially for newly acquired customers. In our experience, businesses that are primarily acquisition-focused find their ROAS numbers and CAC trend upwards over time.
In fact - Brightback’s own research shows that behavior later in the funnel (cancellation ease) directly impacts both referral NPS and likelihood to make additional purchases from a company:
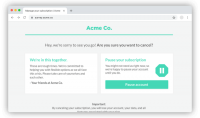
80% of Customers are more likely to purchase a subscription that lets them easily cancel online. - Brightback 2021 State of Industry Survey
Subscription, or retention-focused businesses must think about optimization differently to improve their business results, and look at a set of metrics that evaluate the full lifecycle of the customer.
Measuring LTV, CAC, Churn Rate, and Deflection in a Growth Dashboard

The main problem that any marketing leader needs to address when moving from a one-session or 30-day attribution window is creating a unified lifetime view of the customer. This often means hobbling together data from disparate sources - eCommerce platforms, ad spend data, and billing systems into a singular “subscription health dashboard.” This dashboard should contain the following metrics:
- Lifetime Value: LTV is a measure of the lifetime profit that the customer brings to the business
- LTV = # of Lifetime Orders * Average order value.
- LTV/CAC: If your end goal is to create a profitable business, the right metric to track is not ROAS, but the ratio between Lifetime Value (LTV) and Lifetime Customer Acquisition Costs (CAC). Note that these metrics are not static - a single customer might be reacquired through ads many times in their lifecycle, or saved by offers that become part of the lifetime carrying costs of the customer.
- LTV is a measure of the lifetime profit that the customer brings to the business. Profitable businesses operate at a LTV/CAC ratio of > 1.
- LTV = # of Lifetime Orders * Average order value.
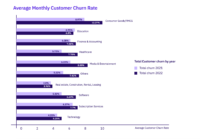
- Churn Rate: In addition to these broad metrics, several point-in time metrics beyond ROAS can be used to predict a profitable LTV/CAC ratio. Churn rate, a measure of the % of your customers that cancel subscription monthly, will predict how many customers you must acquire monthly to maintain your current base. Simply put, a lower churn rate leaves more marketing $ on the table for growth.
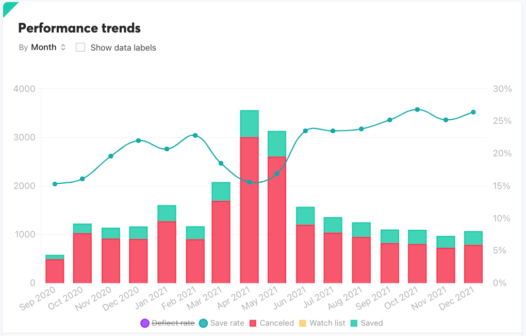
- Deflect and Save Rate: This doesn’t stop even when customers decide to cancel. Within the cancellation process itself, Deflection Rate and Save Rate are measurements of the number of customers who attempt to cancel but are saved, either by content or by offers.
- Deflection is essentially a negative conversion rate - it measures the % of customers who start to cancel but ultimately are deflected.
- Save Rate measures the % of customers who start the process, but ultimately are saved after 30 days .

A Systemic Approach to find churn reasons and increase LTV
Increasing LTV is an optimization problem that requires focus on key parts of the customer experience. To understand which parts of your experience need work, the right place to start is with a retention churn cohort, which shows how many weeks, months, or orders customers stay with your brand before churn. A typical churn cohort looks something like this:

What you see in this chart is that the biggest drop off point for customers occurs in month 3 after first purchase, which indicates this is the key point of discontentment with the subscription amongst the customer base.
We usually see several key drop off points in a typical monthly subscription, each with their own potential reasons for cancellation. Here are some sample use cases for an eCommerce Consumables Product, with a free trial.
Timing | Top Reasons for Dropoff | Mitigation |
Within 7 days of Trial Start eCommerce Consumables Product Subscription 7 day trial |
|
|
30 days after start eCommerce Consumables Product Subscription |
|
|
60 days after start eCommerce Consumables Product Subscription |
|
|
90+ days after start eCommerce Consumables Product Subscription |
|
|
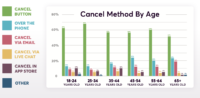
To determine why customers drop off at key points in the lifecycle, the best thing to do is collect information about churn rates from a cancellation survey, which is presented at checkout.
Once causes are identified, the fun begins! We can start to test changes in the subscription program, content changes, offers, and winback campaigns to increase LTV and decrease churn rate.
But that is the story for our next blog article…