Table of contents
While you’re reading hover Bold(1) text for
more info.
People who’ve been in crypto for a long time view the space as evolving in cycles, alternating between periods of high activity and “crypto winters.” There have been three cycles so far. The first peaked in 2011, the second in 2013, and the third in 2017.These cycles appear chaotic but have an underlying order, roughly characterized as 1) the price of Bitcoin and other crypto assets goes up, 2) leading to new interest and social media activity, 3) leading to more people getting involved, contributing new ideas and code, 4) leading to projects and startups getting created, 5) leading to product launches that inspire more people, eventually culminating in the next cycle.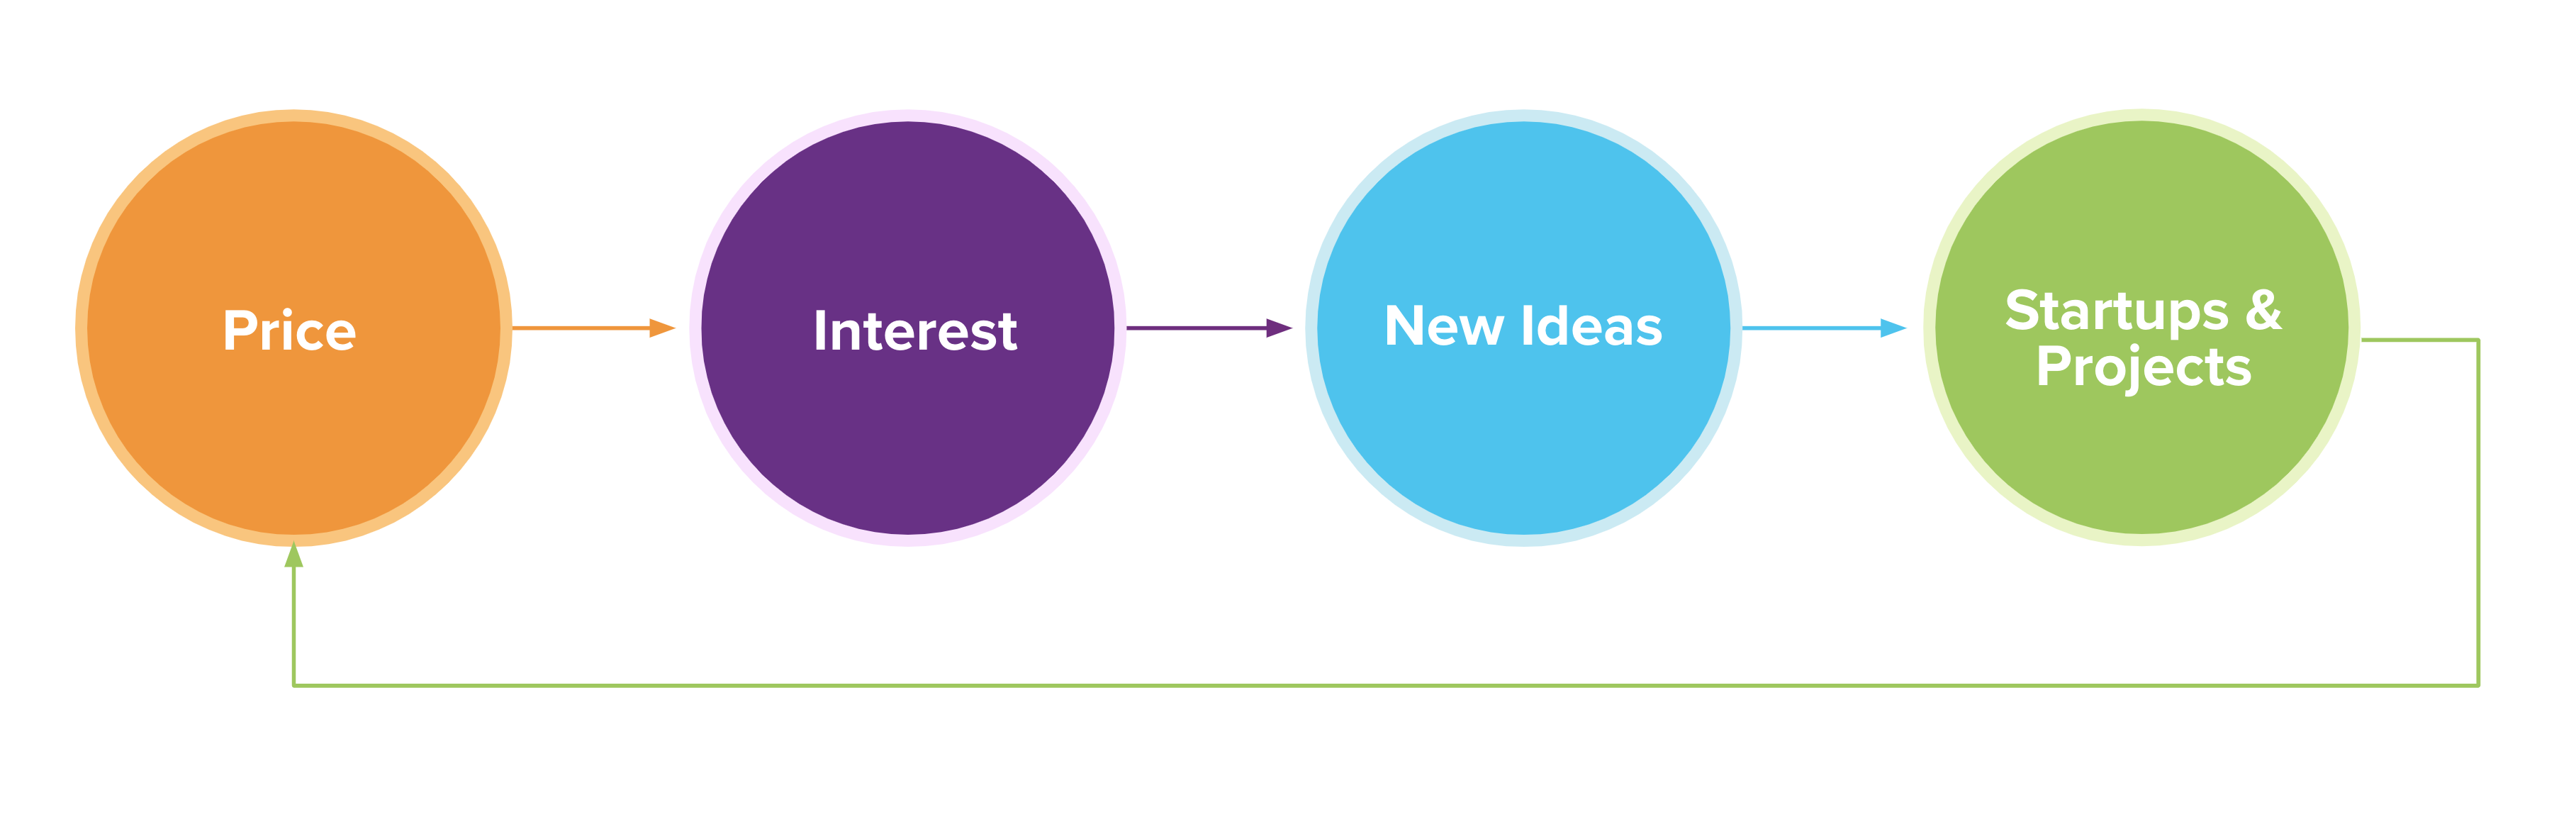 This view is supported both anecdotally and with data. Anecdotally, of the hundreds of conversations with crypto founders we’ve had, we often hear stories like: “I heard about crypto in [2011, 2013, 2017] when the prices spiked and everyone was talking about it. At first, I thought it was just about money, but then I started reading white papers and blog posts, learned more about the potential of the technology, and eventually fell in love with it.”
We recently ran an internal a16z project to see if the data would show similar patterns. Led by our crypto data scientist, Eddy Lazzarin, we analyzed 10 years of data, including Reddit comments in crypto subreddits, Github commits in crypto repos, and Pitchbook funding data (more on the methodology below). The results are shown in the following charts.
The first crypto cycle peaked in 2011. Before this, even enthusiasts thought of Bitcoin as an interesting experiment that was unlikely to have practical value. Afterwards, entrepreneurs realized you could create businesses in crypto. This was when many of today’s largest exchanges, miners, and wallets were founded.
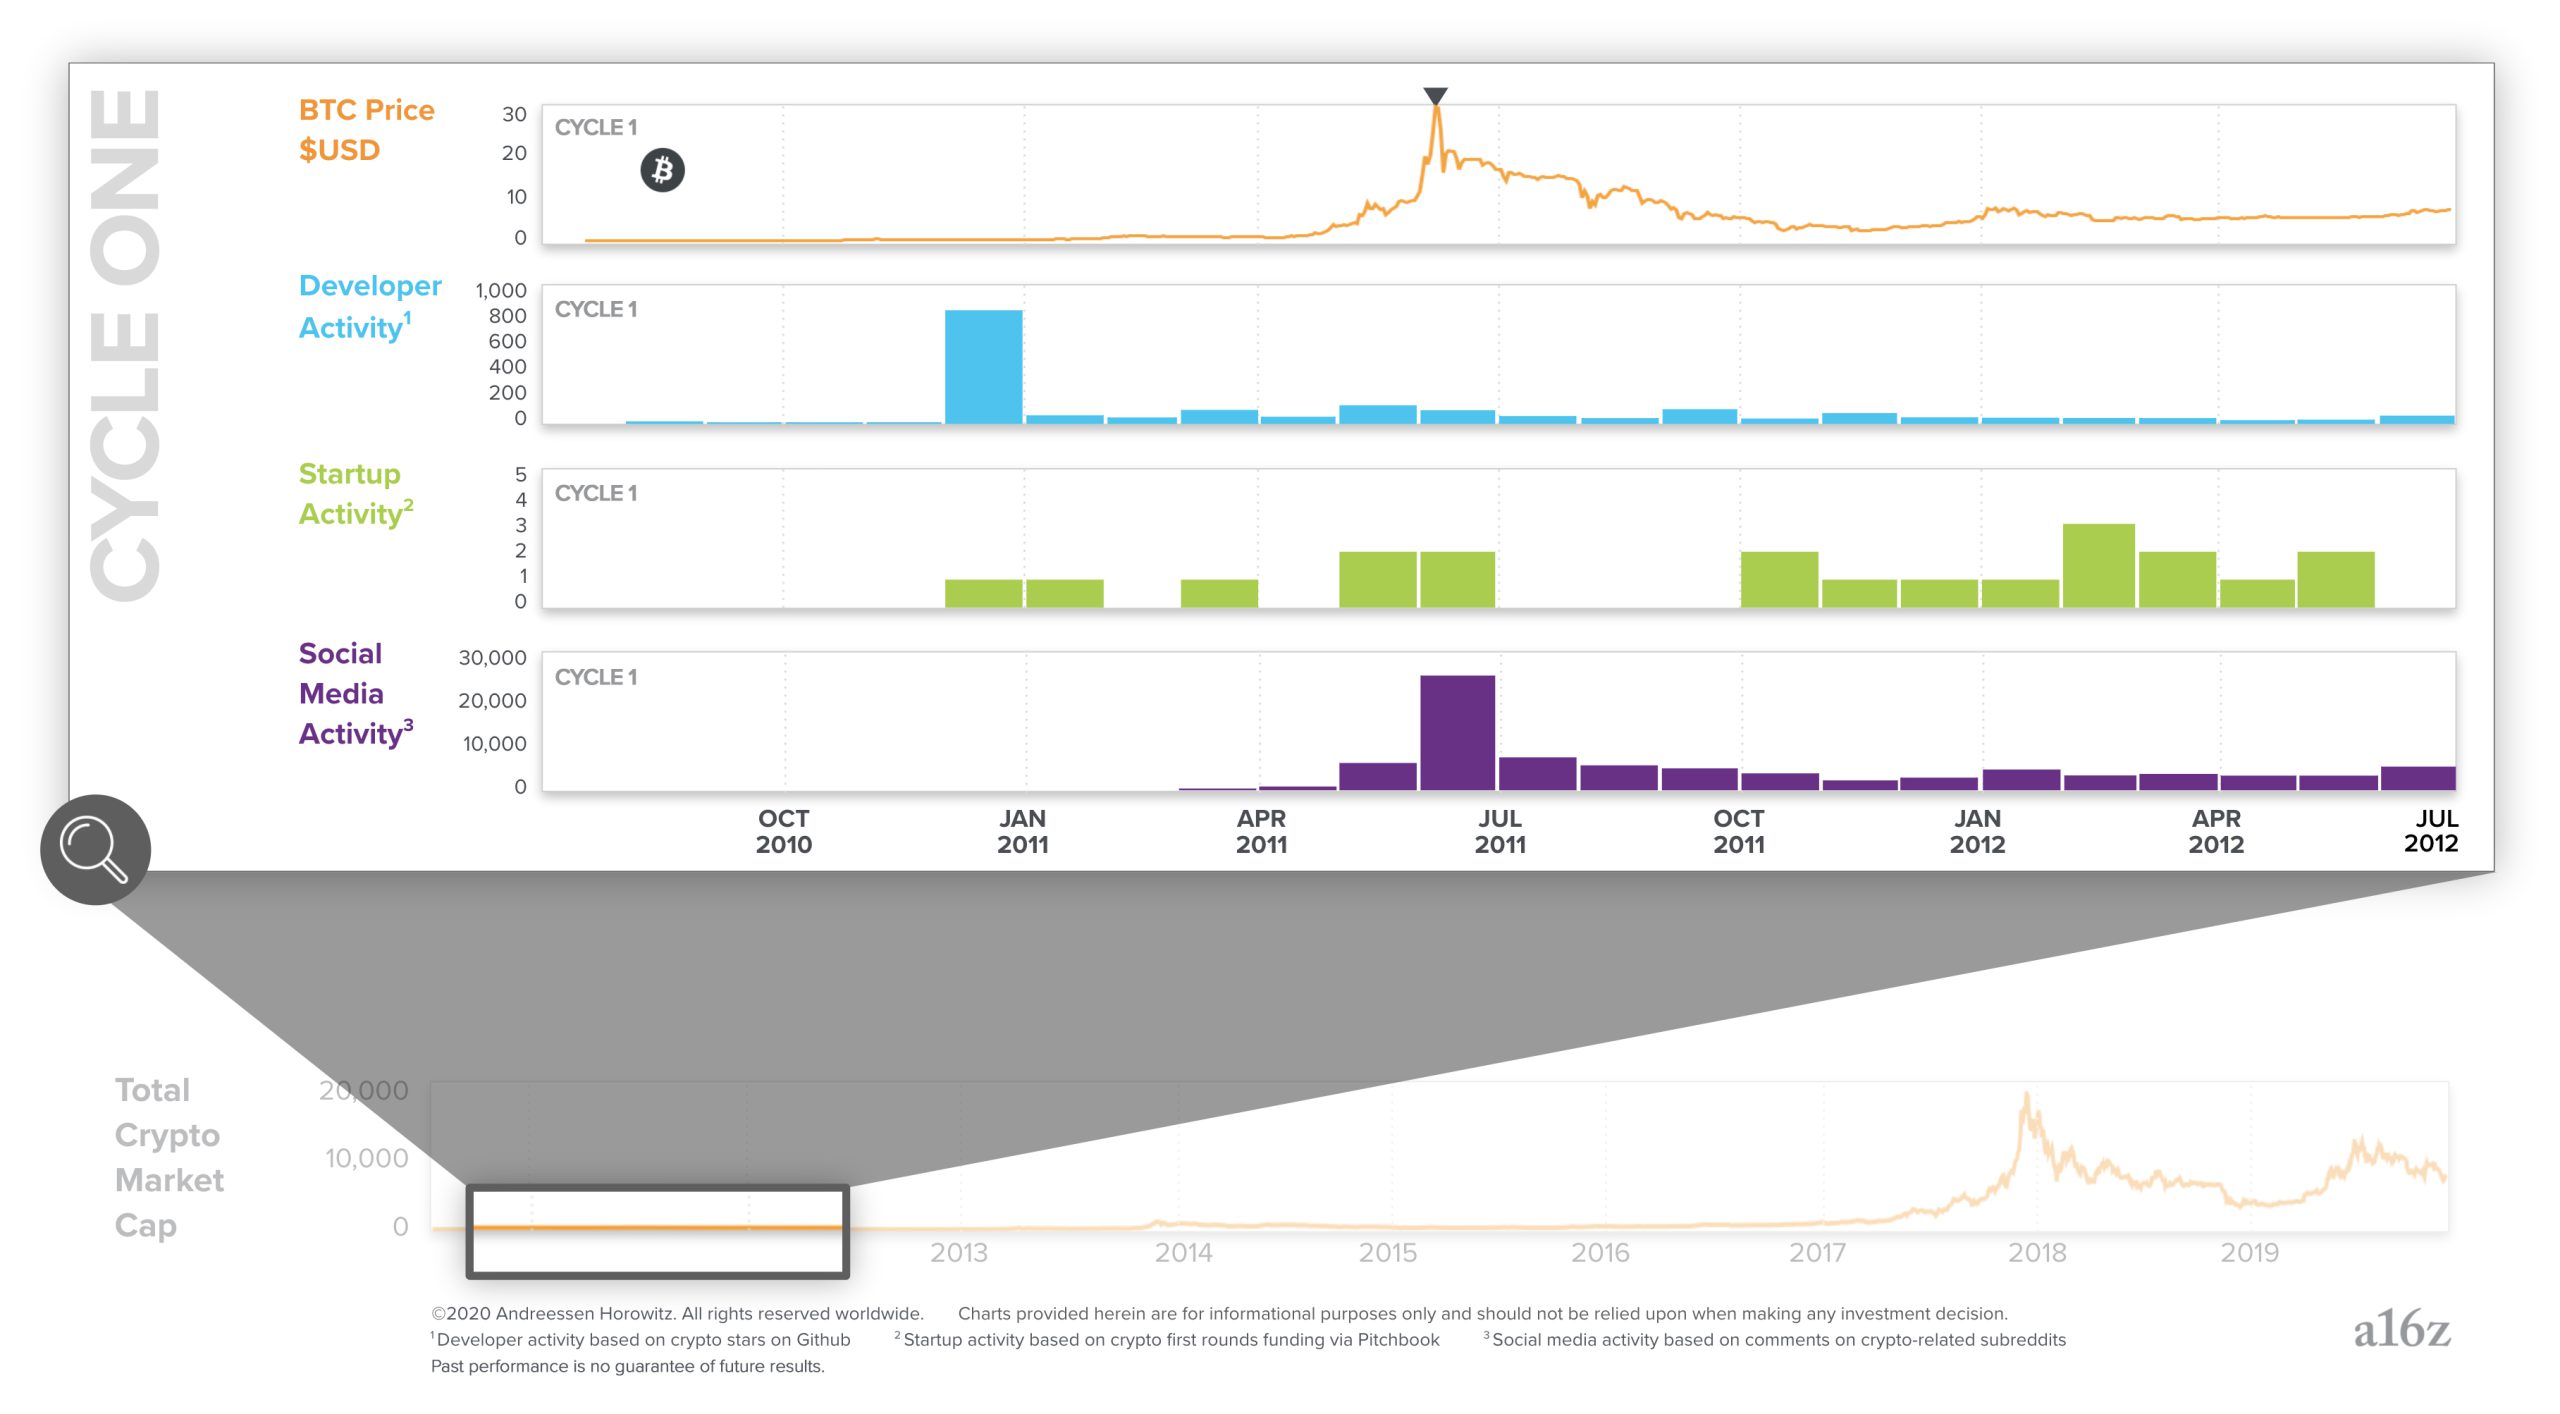
Notice how developer, social media, and startup activity is sustained even after prices decline. As we’ll see later, this is a consistent pattern that leads to long-term steady growth in fundamental innovation.
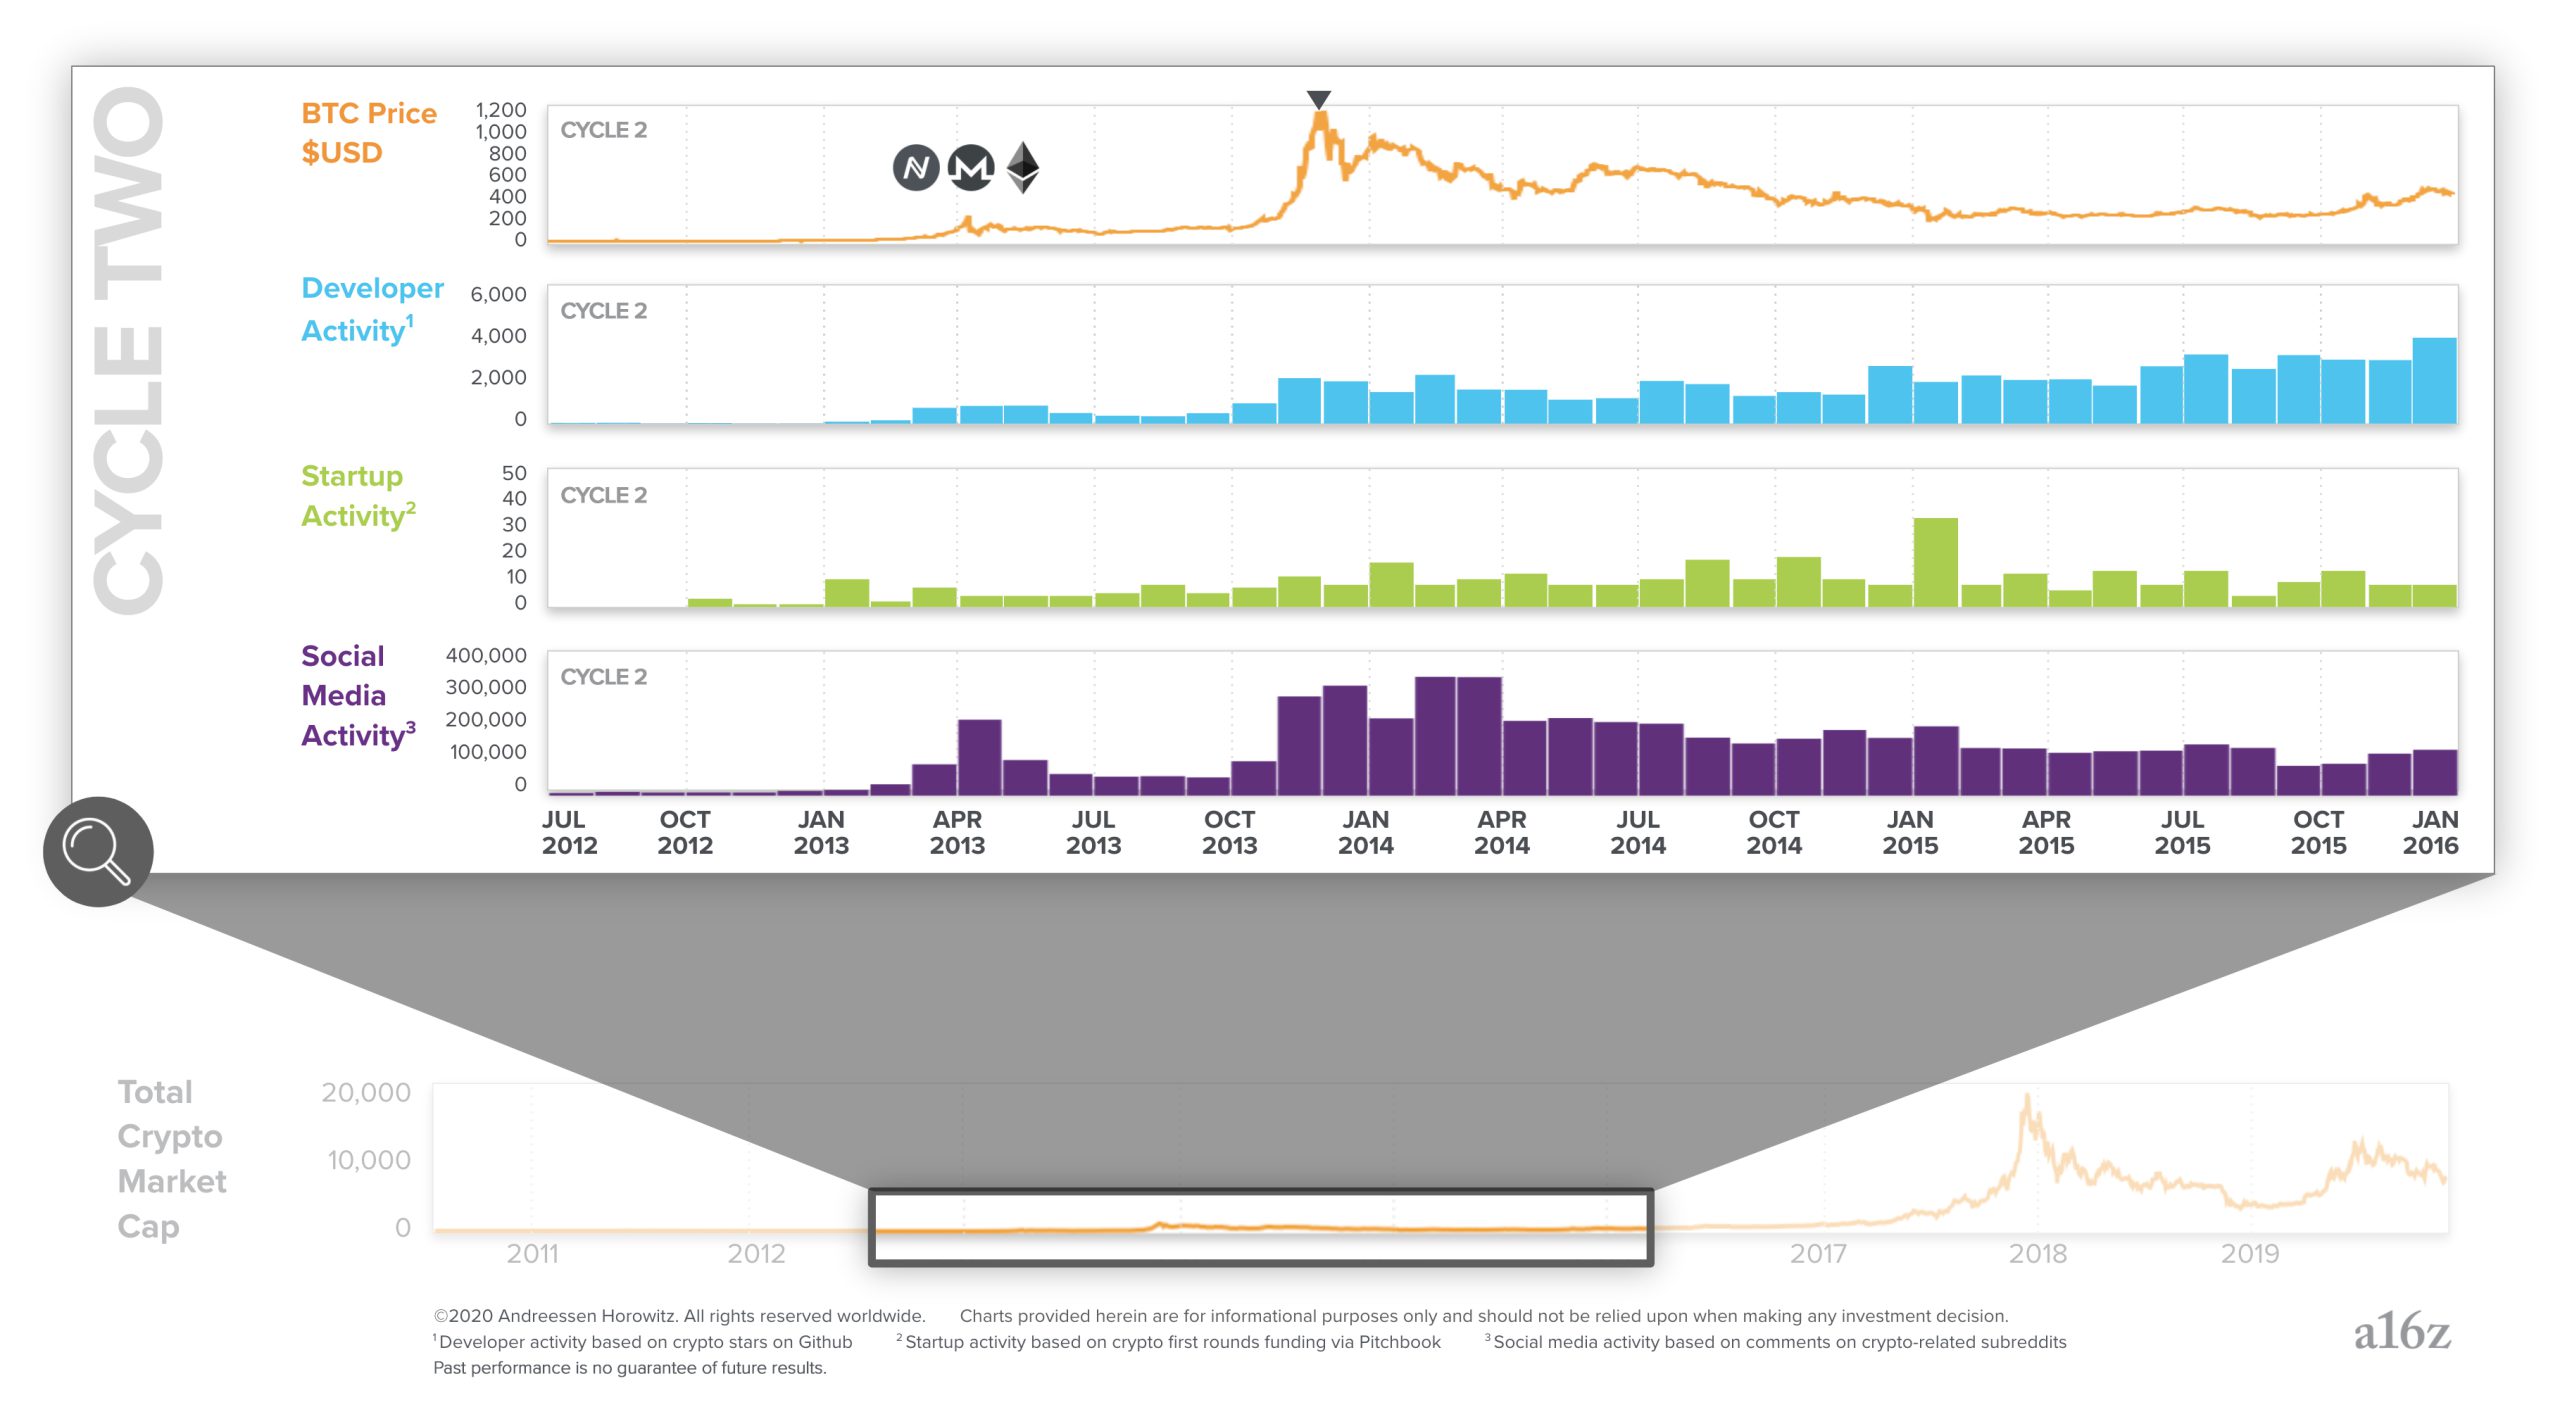
The second cycle, which peaked in late 2013, is probably the first time most people outside of tech heard about Bitcoin. This cycle brought roughly 10x more developers and startups into the space. It was also when important projects were created and funded, most notably Ethereum, which drove a lot of the excitement in the third cycle in 2017. A key feature of crypto cycles is that each one plants seeds which later grow and drive the next cycle.
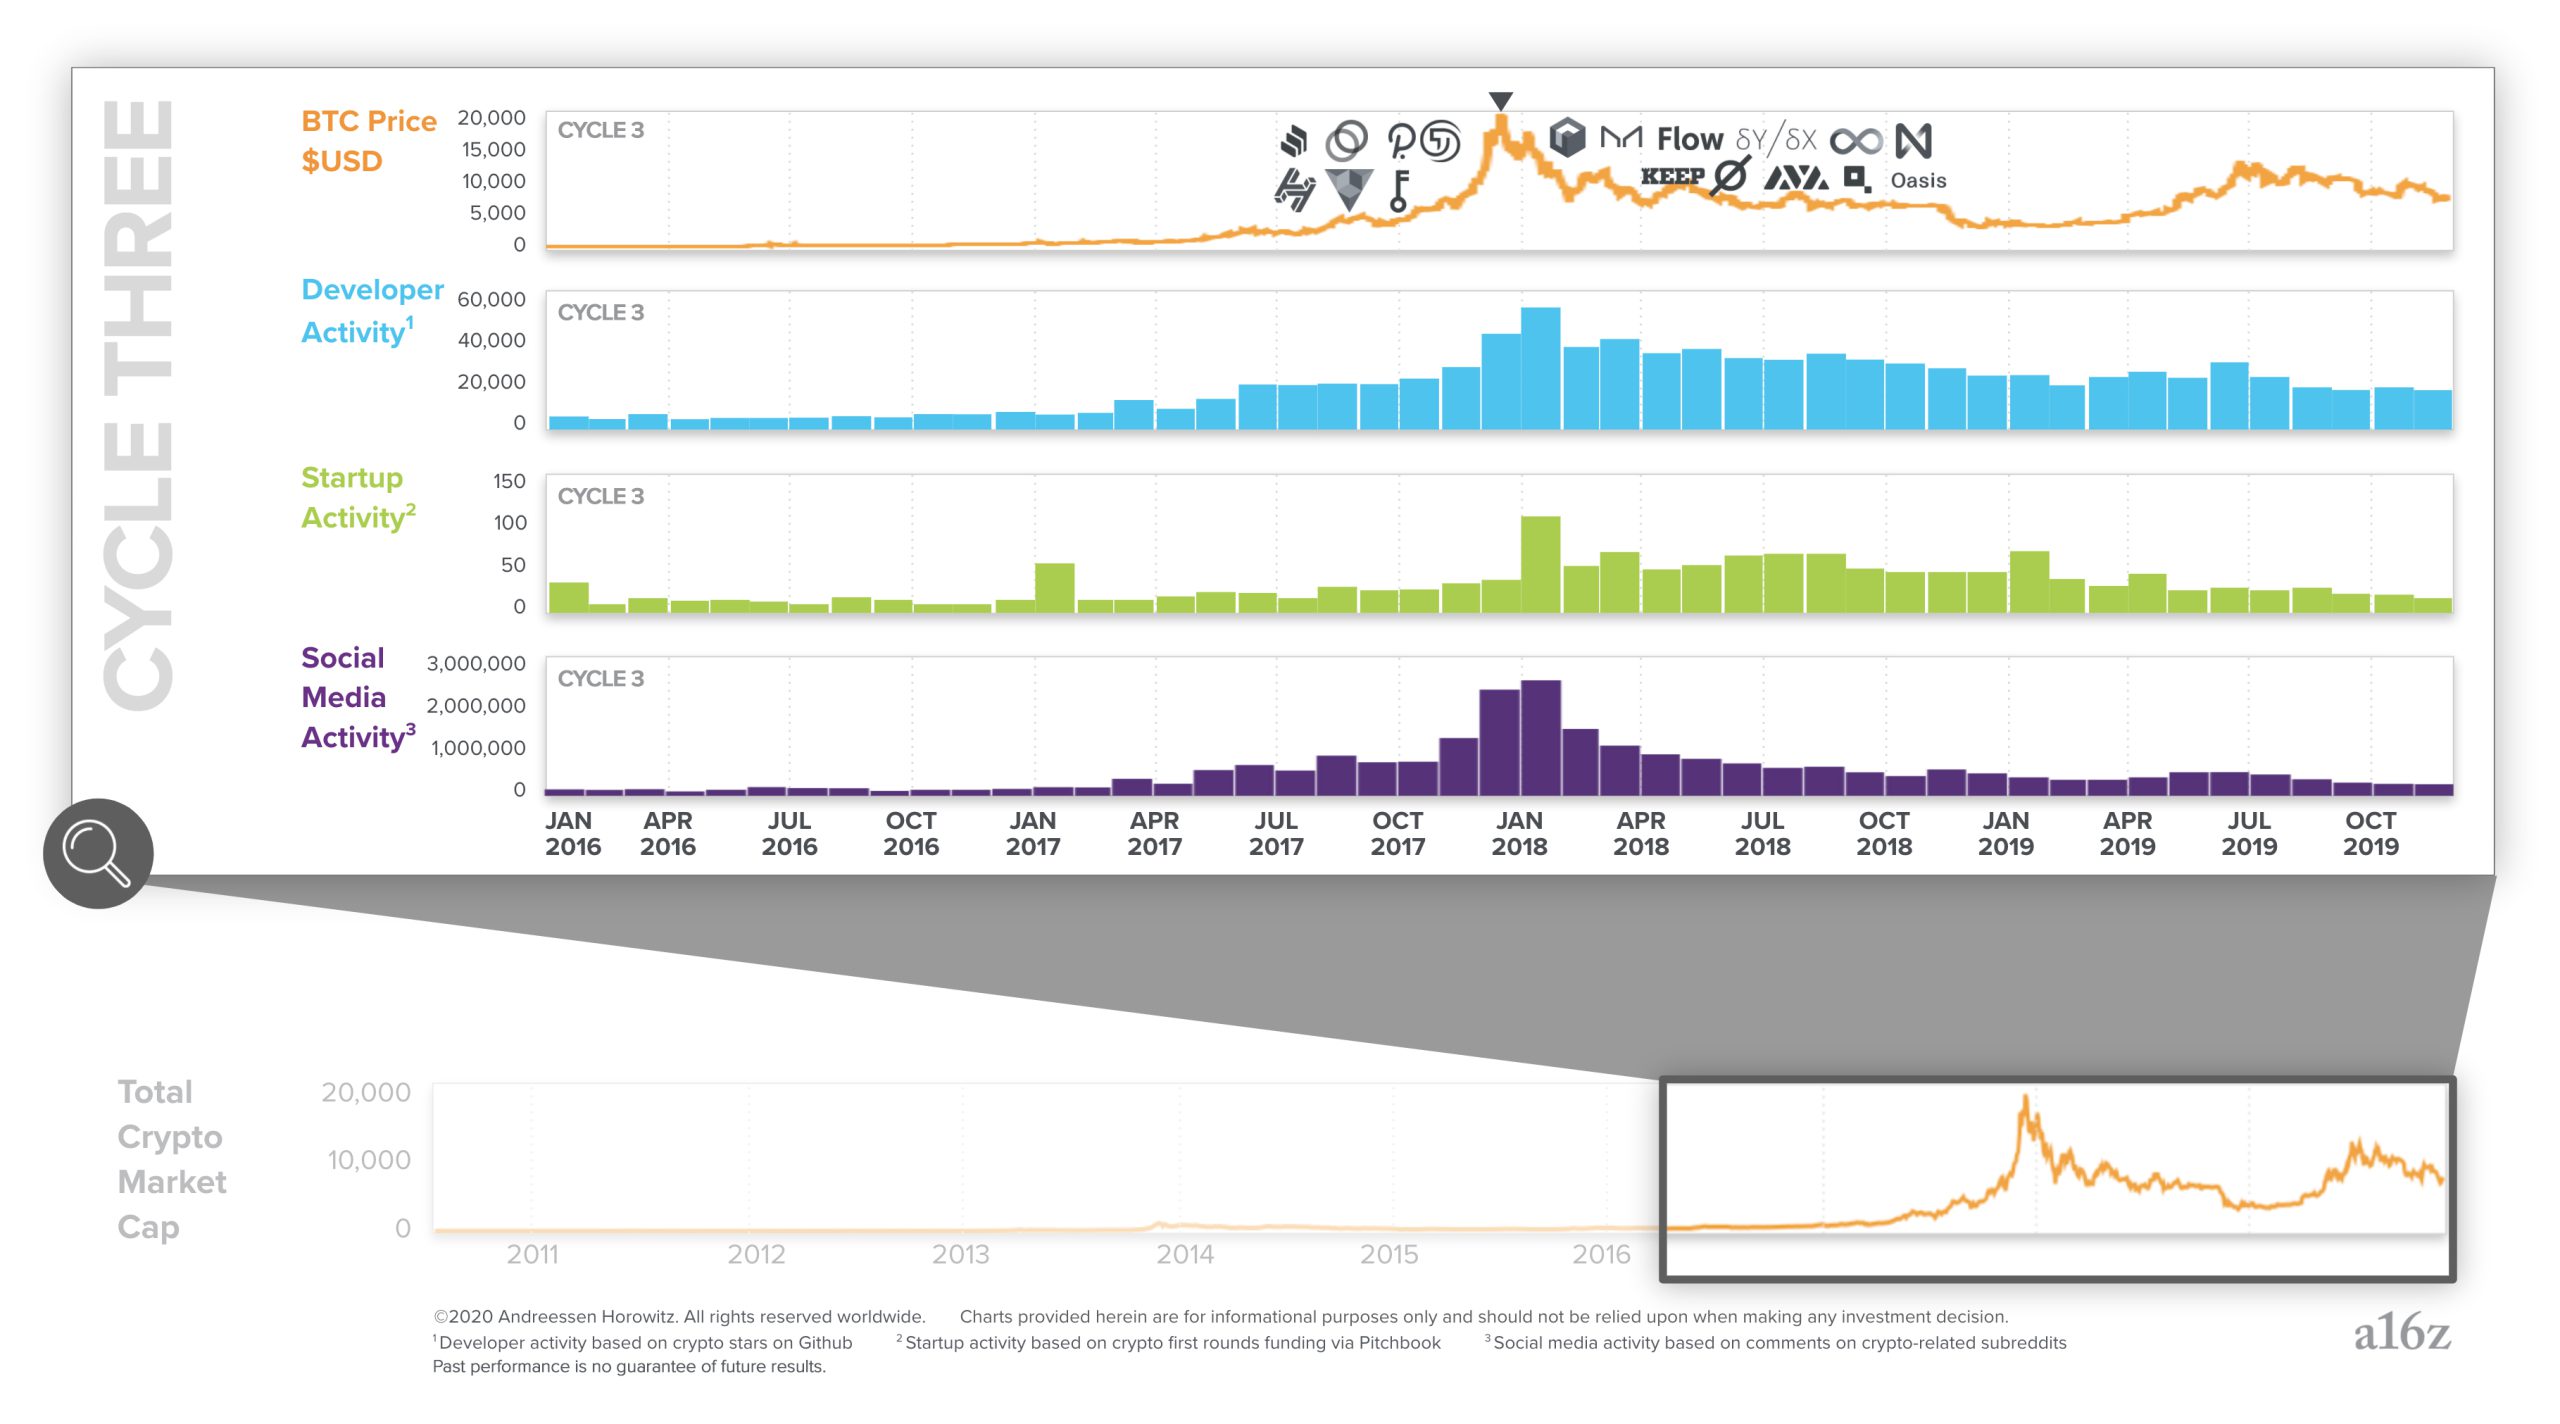
The third cycle, reaching its peak in 2017, is when the broader implications of crypto captured mainstream attention. This cycle again increased the number of developers and startups in the space by another roughly 10x. Crypto moved from the fringe to become a bona fide startup sector.
Zooming back out, when you look at all three cycles combined you see choppy yet consistent growth in all of the key metrics:
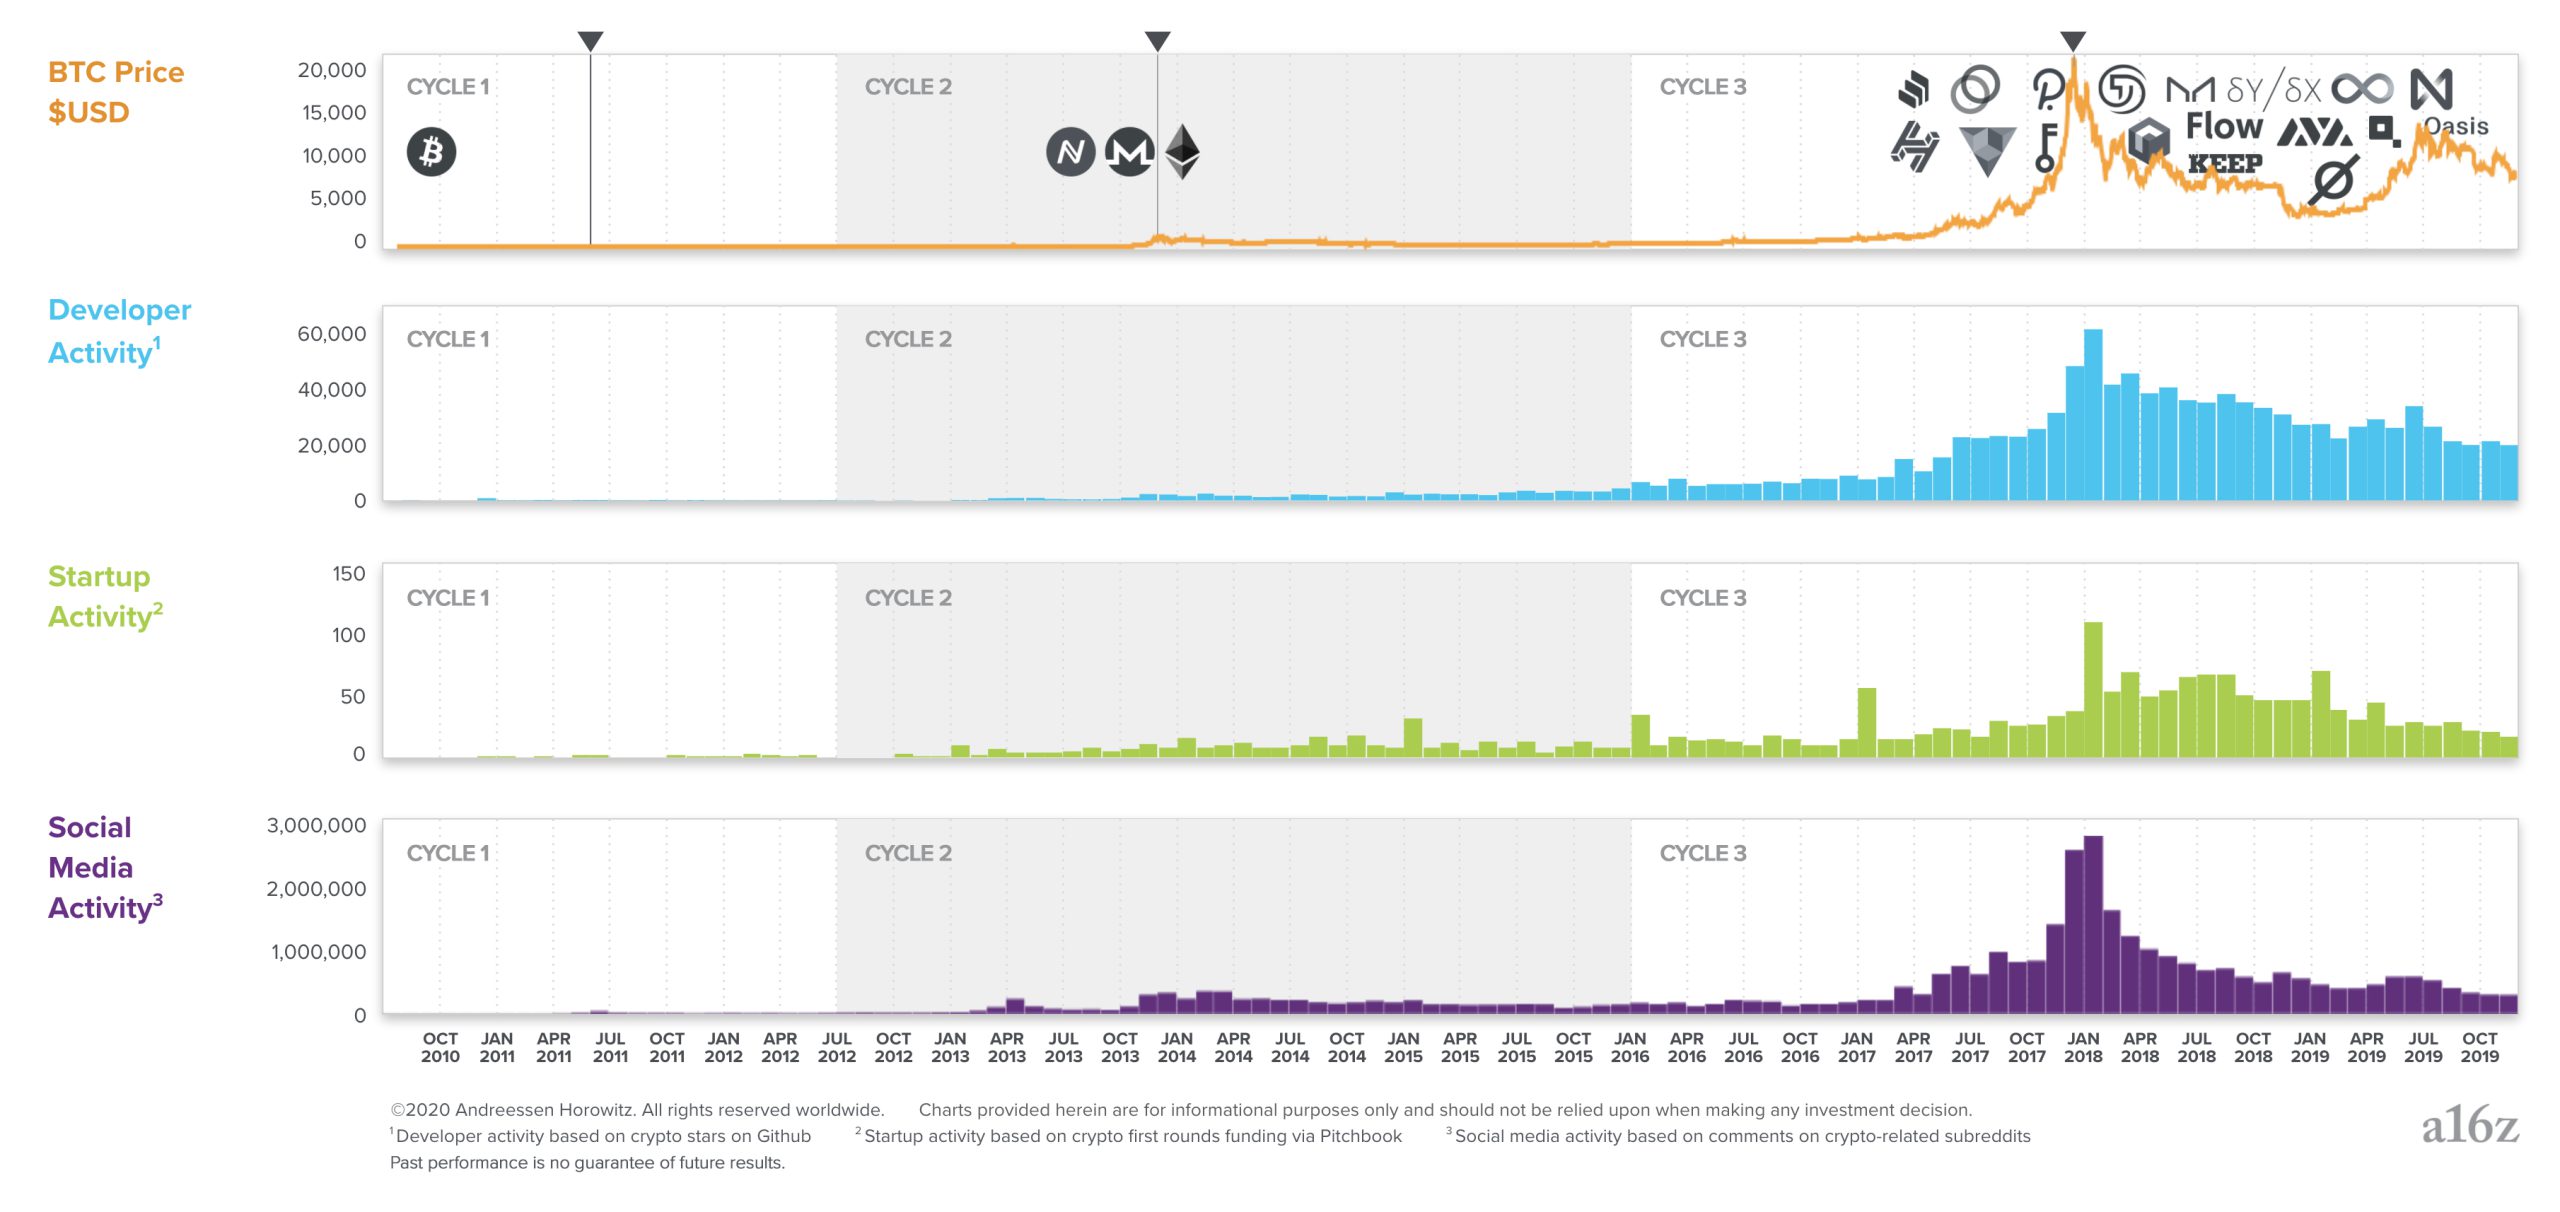
The logos in the top row are a sample of high quality projects started during each cycle. The 2017 cycle spawned dozens of exciting projects in a wide range of areas including payments, finance, games, infrastructure, and web apps. Many of these projects are launching in the near future, possibly driving a fourth crypto cycle.
Finally, here are the compound annual growth rates for each metric from 2010 to the present:
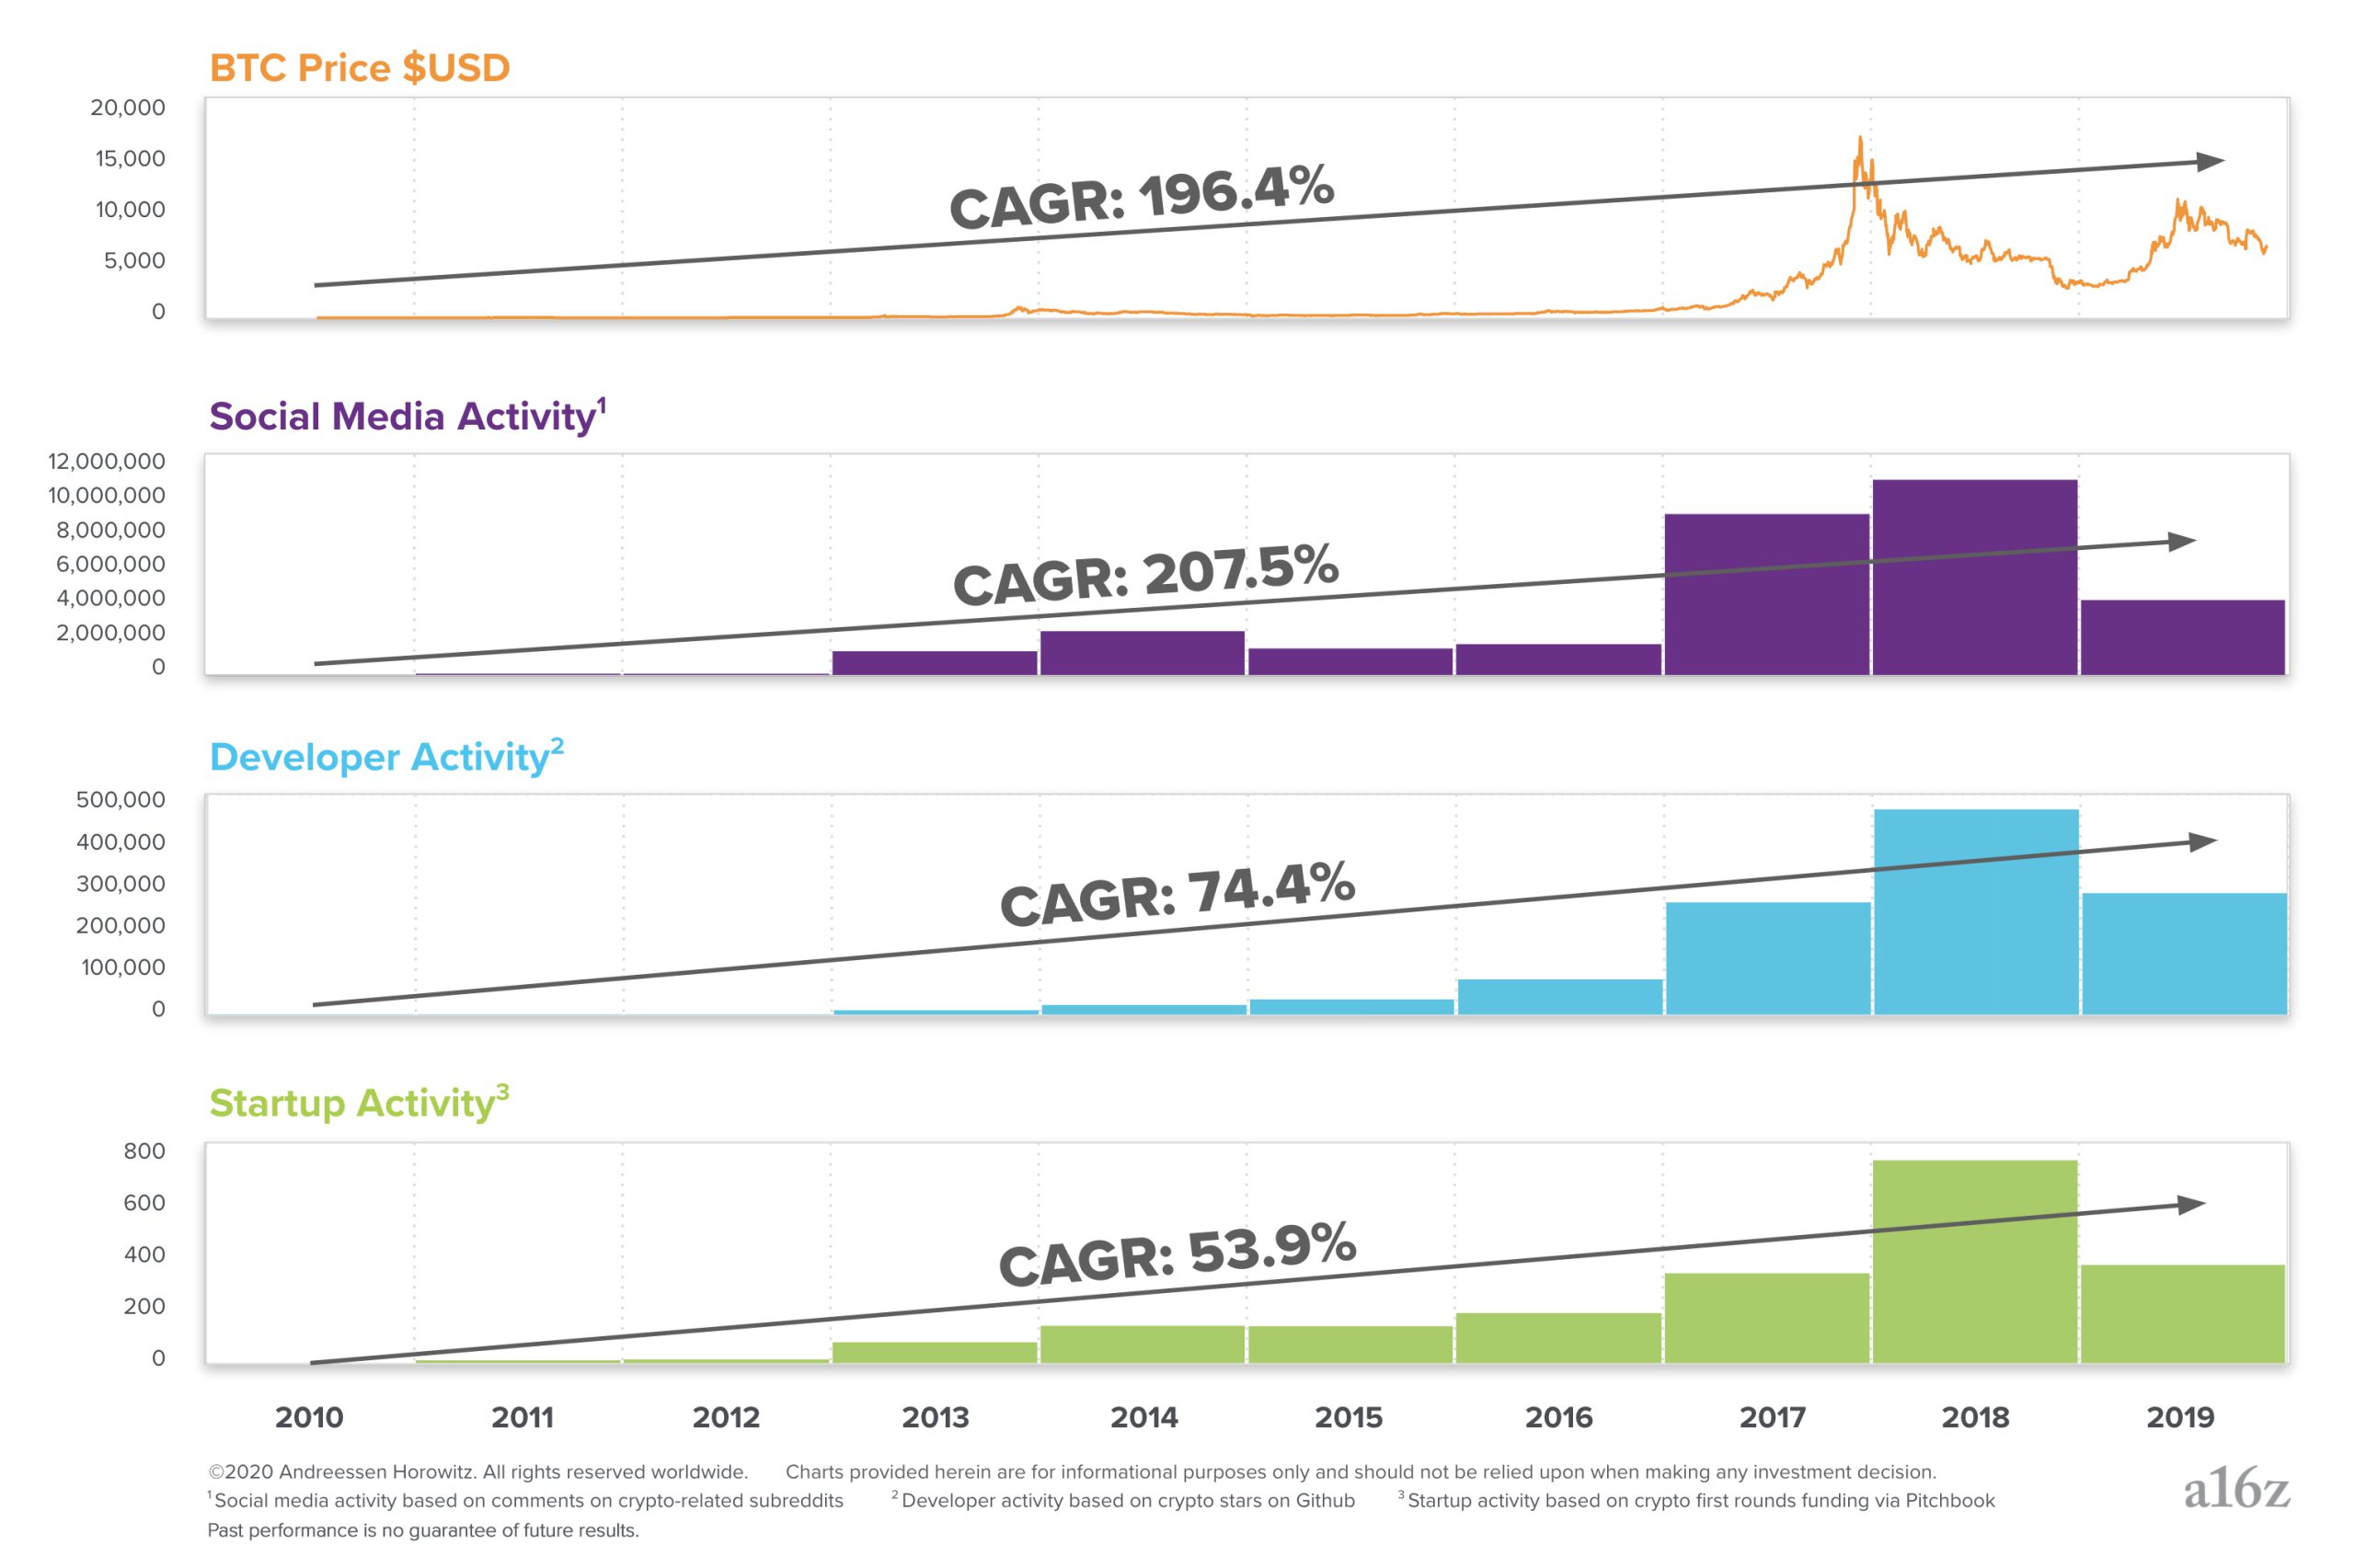
Even though crypto cycles look chaotic, over the long term they’ve generated steady growth of new ideas, code, projects, and startups — the fundamental drivers of software innovation. Technologists and entrepreneurs will continue to push crypto forward in the coming years. We are excited to see what they build.
Methodology:
***
The views expressed here are those of the individual AH Capital Management, L.L.C. (“a16z”) personnel quoted and are not the views of a16z or its affiliates. Certain information contained in here has been obtained from third-party sources, including from portfolio companies of funds managed by a16z. While taken from sources believed to be reliable, a16z has not independently verified such information and makes no representations about the enduring accuracy of the information or its appropriateness for a given situation.
This content is provided for informational purposes only, and should not be relied upon as legal, business, investment, or tax advice. You should consult your own advisers as to those matters. References to any securities or digital assets are for illustrative purposes only, and do not constitute an investment recommendation or offer to provide investment advisory services. Furthermore, this content is not directed at nor intended for use by any investors or prospective investors, and may not under any circumstances be relied upon when making a decision to invest in any fund managed by a16z. (An offering to invest in an a16z fund will be made only by the private placement memorandum, subscription agreement, and other relevant documentation of any such fund and should be read in their entirety.) Any investments or portfolio companies mentioned, referred to, or described are not representative of all investments in vehicles managed by a16z, and there can be no assurance that the investments will be profitable or that other investments made in the future will have similar characteristics or results. A list of investments made by funds managed by Andreessen Horowitz (excluding investments for which the issuer has not provided permission for a16z to disclose publicly as well as unannounced investments in publicly traded digital assets) is available at https://a16z.com/investments/.
Charts and graphs provided within are for informational purposes solely and should not be relied upon when making any investment decision. Past performance is not indicative of future results. The content speaks only as of the date indicated. Any projections, estimates, forecasts, targets, prospects, and/or opinions expressed in these materials are subject to change without notice and may differ or be contrary to opinions expressed by others. Please seehttps://a16z.com/disclosures for additional important information.