What’s really going on in the world of SaaS right now, from software valuations to business performance to interest rates? At Workshop Wednesday, held every Wednesday at 10 a.m. PST, Jamin Ball, Partner at Altimeter Capital and author of Clouded Judgement, took us through the current state of SaaS and what we should expect in 2024.
Software Revenue Multiples
On the chart below, the darker blue line shows the median revenue multiple for 100 software companies. The light blue line is the 10-year interest rate, and the horizontal gray line is the long-term average multiple. For those unfamiliar with revenue multiples, it’s a valuation methodology for comparing relative valuations of businesses.
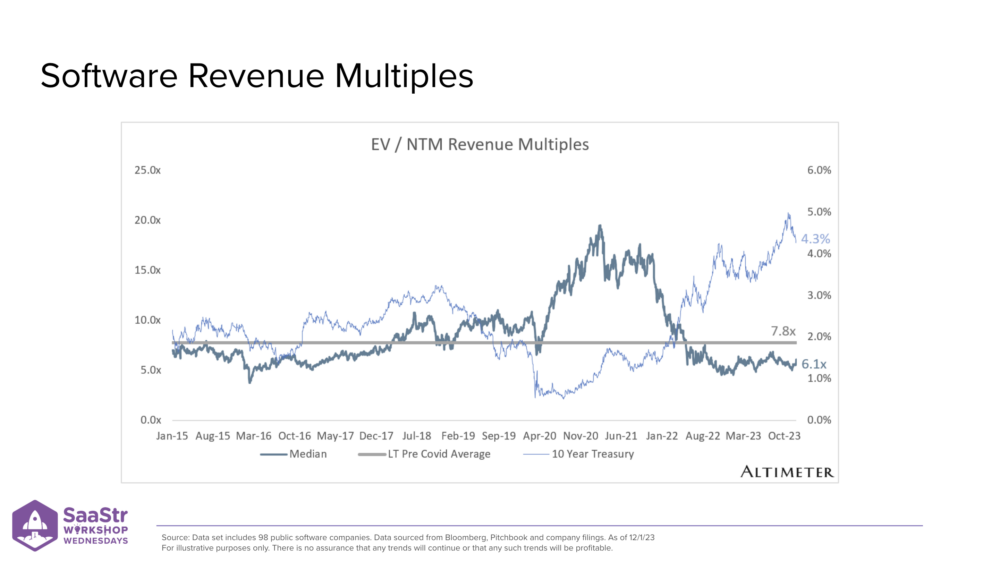
In practice, you take the valuation of a business and divide it by some metrics to get a multiple. Most commonly, the metric for software is forward revenue — Next 12 Months (NTM). Other metrics you can use to value companies are free cash flow or net income, but not all have that, so the multiple would be negative. Revenue is a great way of level-setting the relative valuations of public software companies.
If you look at the period on the chart, between April 2020 and the start of 2022, you can see how anomalous that was when it comes to public valuations relative to the history of software valuations since a lot of software valuations are tied to interest rates, and at that time they went to nearly net zero. Since then, however, we’ve see a steady decrease in valuations and an increase in interest rates.
Median Revenue Multiples and Growth Rate is Down

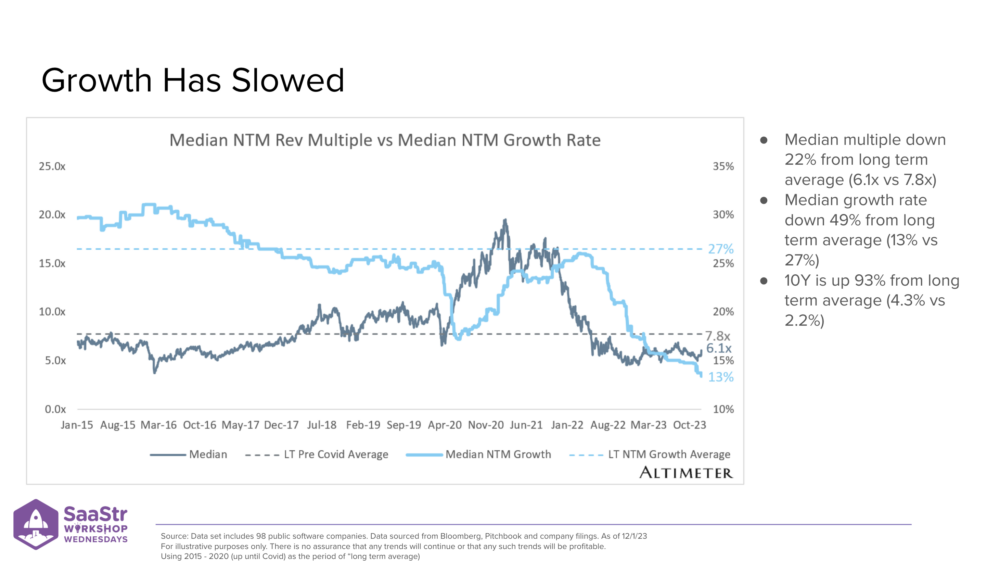
This chart is similar to the previous one but without the 10-year rate. Now, a light blue line shows the median consensus NTM growth rate for that same 100 software companies. You can see that the median multiple is down about 22%, but at the same time, the median growth rate (forward-facing) for public SaaS companies today is 13%.
By comparison, the median growth rate for these businesses from 2015-2017 was 27%. So on the one hand, we can look at this data and say the average median multiple is 22% lower than the long-term average, but the median growth rate is down nearly 50%. At the same time, the 10-year benchmark rate has gone from 2.2% to 4.3% today, so the ten-year is up almost double.
There are two reasons for this. You can look at a business and think the best way to measure intrinsic value is free cash flow. The reality with software is a lot of free cash flows are heavily weighted towards the outer years. Most aren’t generating much today but will over time as margins expand and figures grow. So, the interest rate goes up, and the discount rate goes up.
Another reason increasing interest rates has an inverse effect on software valuations is because of risk. When you think of big asset managers, they allocate their capital across a wide span of asset classes like real estate, credit, software, etc. Software is a riskier investment. When interest rates go to zero, you have an asset class you won’t get a return on. You can invest in a security bearing 0% interest, but you won’t get a return, so folks generally don’t want to allocate capital to risk-free assets. However, when interest rates go up, you get big flows of capital going from high-risk to risk-free, and it pulls down multiples.
Software Growth-Adjusted Revenue Multiples
This slide wraps up everything shared above and looks at the growth adjusted multiple divided by your growth rate. The light blue line shows the median growth adjusted software multiple, and this chart is really the most telling because it shows the median long-term average right around 0.3x. But where we are today is about 60% higher than that, even in an interest rate environment that is higher.
The takeaway from this chart is that on a growth-adjusted basis, the software universe isn’t that cheap today. You could say it’s relatively expensive compared to the long-term average.
Why is that? Is it because business quality has gone up? Are these businesses more profitable or have higher free cash flow margins? Are there expectations that rates will go down or that growth will reaccelerate?
Let’s look at more data.
Software Free Cash Flow Multiples
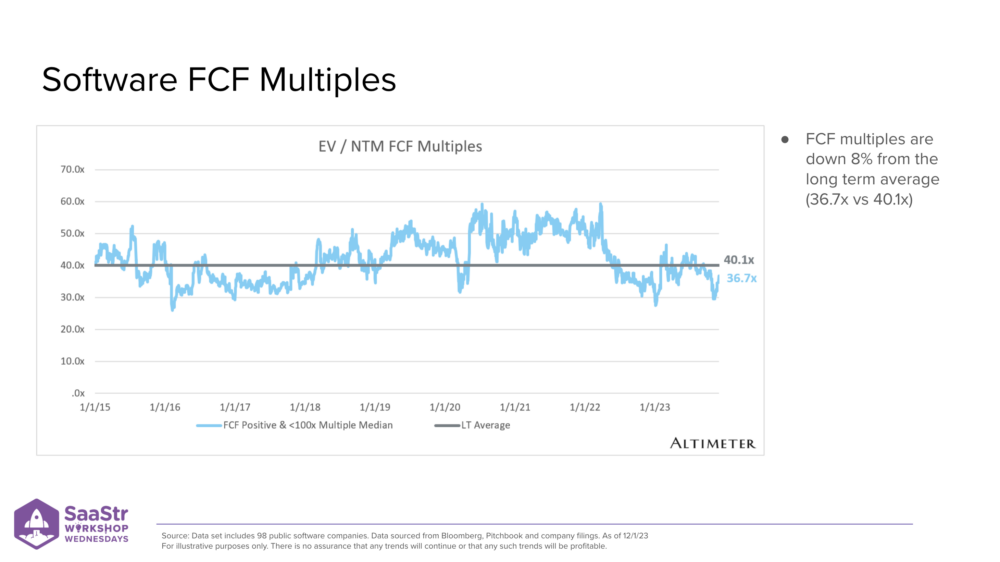
This chart shows software companies that are free cash flow positive. The multiples here look crazy high because you’re dividing by a really small number. This chart also removed companies with a negative multiple and those with greater than 100x multiple because they aren’t relevant to relative performance.
So how have FCF multiples trended over the last few years? You see a lot less volatility. No crazy spikes like in 2020-2021 for revenue multiples. You do see a spike, but it’s not as dramatic. And the median free cash flow multiple is about 10% lower than the long-term average.
“Good businesses” generating cash are closer to their long-term average yet still below it, which is expected given the interest rate environment.
Look at the Business Performance of Public Companies to Gain Insights
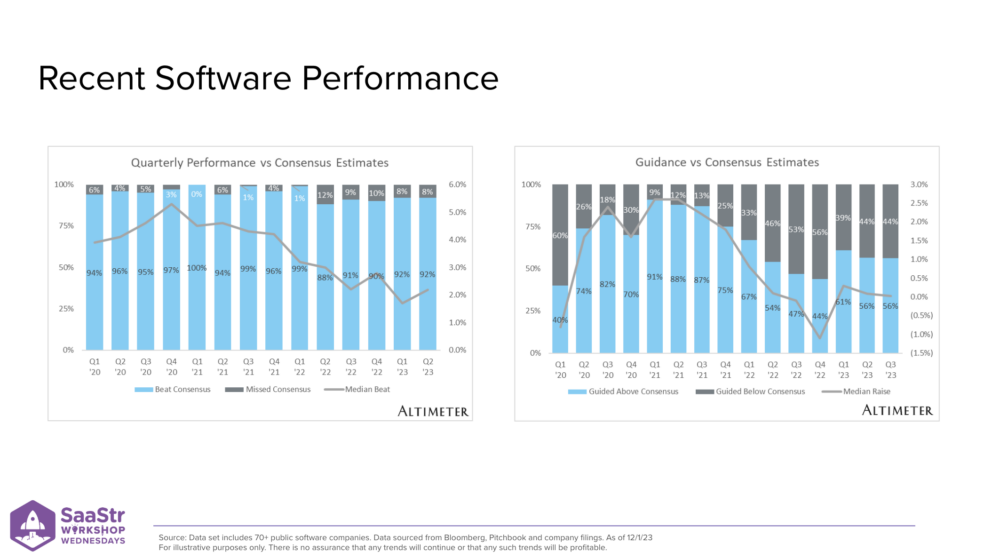
How can we look at the business performance of public companies to gain insights? The chart on the left shows public companies’ reported quarterly earnings, where we get a glance into how they performed that quarter and what to expect in the immediate short-term.
Two metrics that folks like tracking are:
- How does a company’s quarterly performance compare to the consensus estimate (did they beat it or miss it)?
- By what margin?
These two charts show the bar charts of a binary yes or no of beating the consensus estimate and guidance vs. consensus estimates. That gray line is the margin of beat or miss. Generally, software companies are beating current quarter estimates. They have been beating it by smaller margins, and that same trend holds when looking at consensus estimates.
Companies are guiding about 2% above the next quarter or 80% beating guidance. Right now, it’s about 50/50, and the average guide is basically flat because of that split. When will the guidance raises be closer to 1% or 2% vs. kind of flat? That’ll be a good leading indicator that companies are more confident in the short-term outlook.
Is Net New ARR Growth Starting to Rebound?
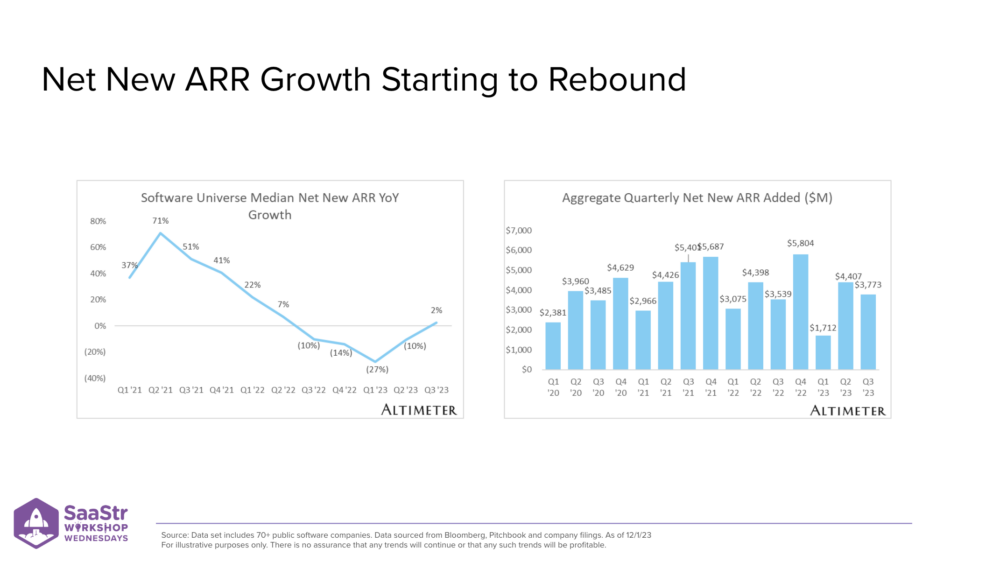
We did a whole deep dive on this one, but here’s a positive chart that looks at every quarter of net new ARR added, which says, from one quarter to the next, how much incremental ARR was added to your business. What we’ve seen is, for a few years, that figure and growth rate have slowed or shrunk every quarter, except the last few quarters.
This is a good potential leading indicator that the tide is starting to turn a little. 2024 could be an exciting year for reacceleration. There is an element of expectation that performance will reaccelerate in 2024, and we’ll see those growth-adjusted multiples normalize a bit as the growth rate goes up. And as the growth rate goes up, multiples come down.
The last few quarters have been a positive signal that growth is rebounding a little.
Additional Performance Metrics
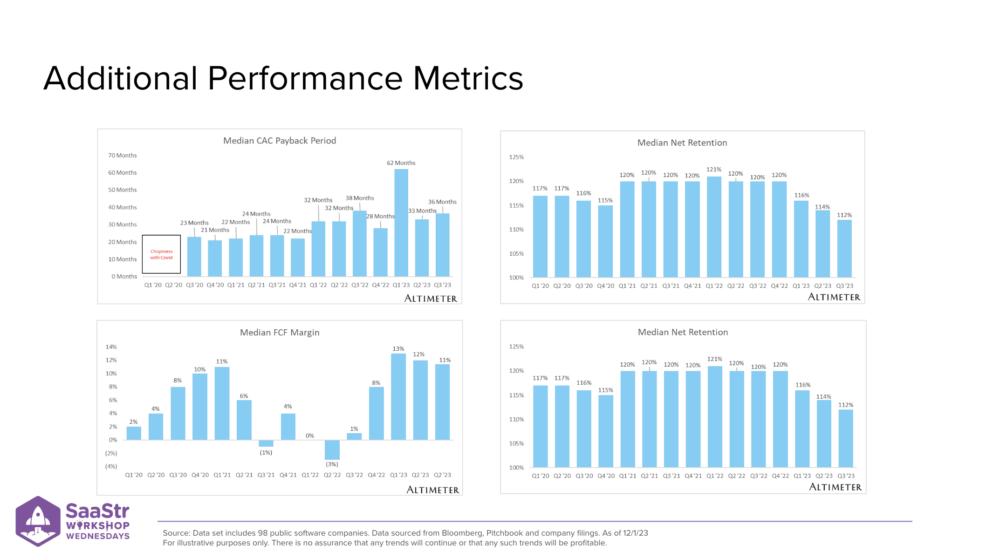
Net retention has fallen from 120% to closer to 110%, and indicates a lot more pressure in private and public companies. Existing companies are expanding less than they have. They’re right-sizing contracts, consumption, and number of seats. It’s a lot harder and more pressure to grow from the existing customer base than in the past.
The bright side is the bottom left chart. You can see a big change in the profitability profile of the universe of software companies. In 2021, you see emphasis shifting from profitability to growth at all costs. Businesses focused on growth and generating more revenue, so FCF margins dropped. The last few quarters have seen that rebound of 10% median FCF margins.
The takeaway is it’s time to get fit and focus on profitability and not simply growth.
The Market is Rewarding Profitable Growth
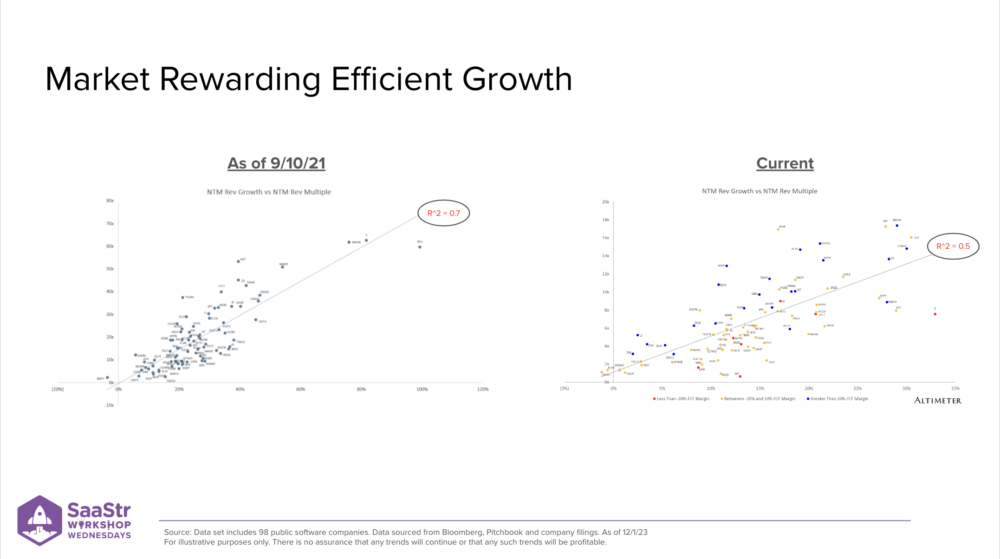
If we rewind the clock to September 2021, you can see that the correlation between revenue multiple and growth rate was quite high. On the right side, you can see the correlation has broken down.
The takeaway is the high concentration of blue dots above the line. If you’re generating real FCF, odds are you’ll be rewarded with higher valuations relative to your growth rate. The market is rewarding profitable growth now.
Rate Expectations Are Coming Down
How do rates impact software valuations? What’s going to happen to rates? Rates can rise or fall because of inflation and economic growth. The main reason the Fed raised rates was because inflation started to rise out of control.
One way to combat that is by increasing interest rates. If rates are higher, the cost to borrow is higher, and spending goes down. It puts downward pressure on inflation. One reason you’d cut rates is the exact opposite. If inflation is no longer high, you don’t need to keep rates super high. Another reason to decrease rates is if the economy starts to slow down or is heading into a recession.
We’ve seen inflation come down over the last months or quarters.
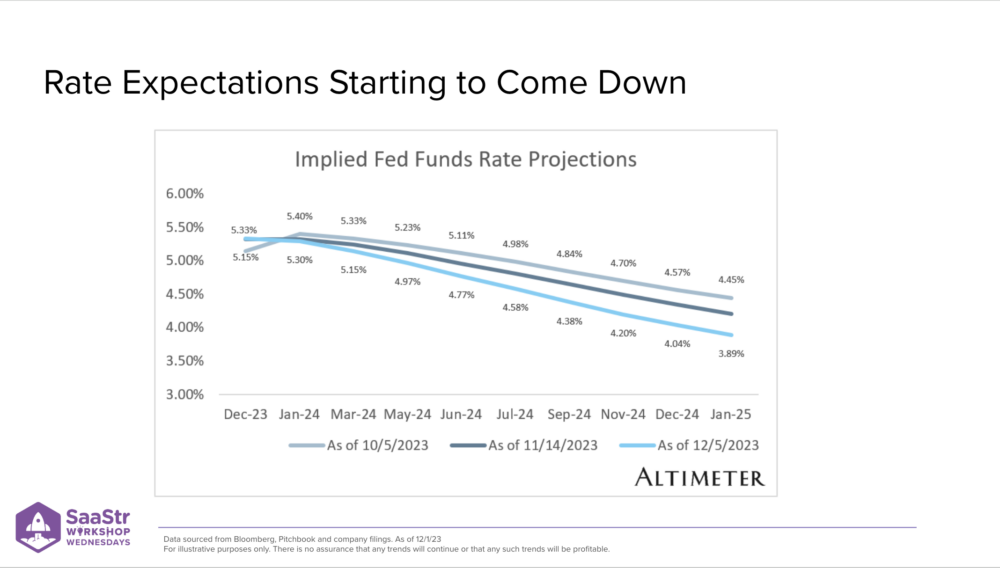
In the same way increasing makes a pullback on spend and inflation, taking rates down can lead to an increase in spending and is a form of stimulus. Rates could come down because the Fed is projecting the economy slowing down and wants to stimulate it. The chart above is the implied Fed funds rate projections as of two months ago, one month ago, and today.
Projections have meaningfully come down over the last few months, a leading indicator that the economy is heading to more of a slowdown than people think.
Rate and rate expectations are coming down, but if it’s because inflation is coming down, that’s great! If the economy is slowing down, that’s not so great.
The reality is it’s probably a little of both. That’s what makes 2024 so fun. We’ll get more data on whether it’s the former or the latter.
Key Takeaways for the State of SaaS
- Valuations today probably appear expensive relative to profitability, growth, and interest rates. Jamin doesn’t expect a “bounce back” in public valuations.
- Interest rates have been a headwind to valuations since the end of 2021. As we head into 2024, it appears that rates will start to become a tailwind to valuations.
- The current debate is: Do we have a hard or soft landing in 2024, i.e., are rates declining because economic growth is expected to deteriorate or because inflation is coming down and rates this high are no longer needed?
It appears more clear that we’re no longer in a rate-hiking cycle. Rates are no longer a headwind, so hopefully, we’re headed into a soft landing. Jamin shares one caveat. When it comes to macro, you’re either wrong or lucky.