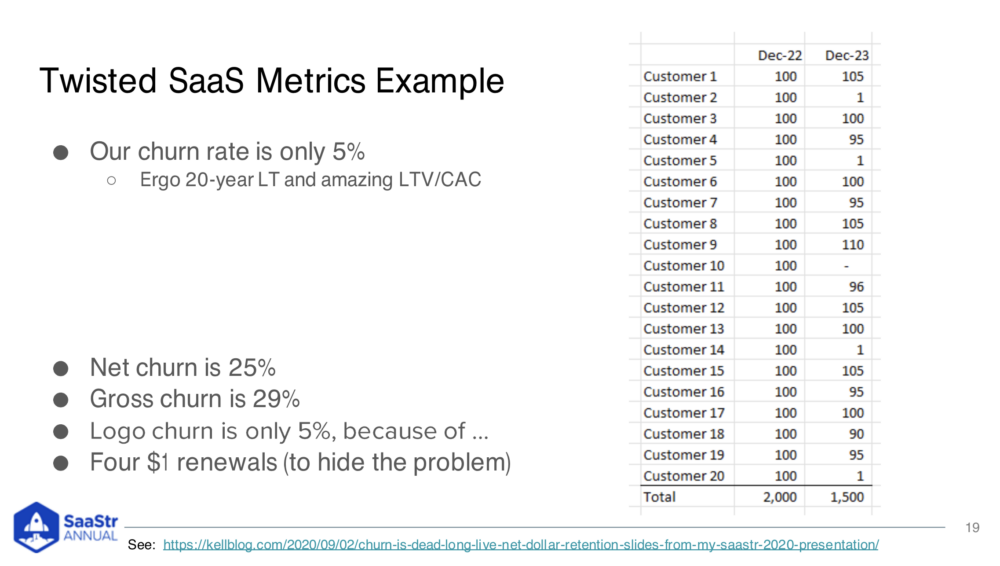
Numbers don’t lie, but sometimes the stories we tell around them do. Dave Kellogg, EIR at Balderton Capital and 25-year C-level veteran, shares the top 14 signs that you have a SaaS metrics problem, the five reasons those symptoms exist, and a SaaS metrics maturity model with five layers to help you move the needle at every stage.
First, let’s deep dive into the 15 ways that people misuse and abuse SaaS metrics. By understanding the problems, you can extract the solutions.
The 15 Types of Misuse and Abuse of SaaS Metrics
#1: Bludgeoning.
Numbers are used to bludgeon management. This is when SaaS metrics aren’t used as a tool of understanding to improve your business but to club people with numbers. Boards do it to CEOs, and CEOs pass it along to CROs. Bludgeoning is an abuse of metrics used as a tool of oppression, not understanding or enlightenment.
#2: Misleading.
People use SaaS metrics to mislead and obscure, not to enlighten. People mislead because they’re afraid of being bludgeoned, or they don’t have a functional relationship with the Board, so it’s seen as something to survive. Let’s look at one of the world’s simplest examples of misleading.
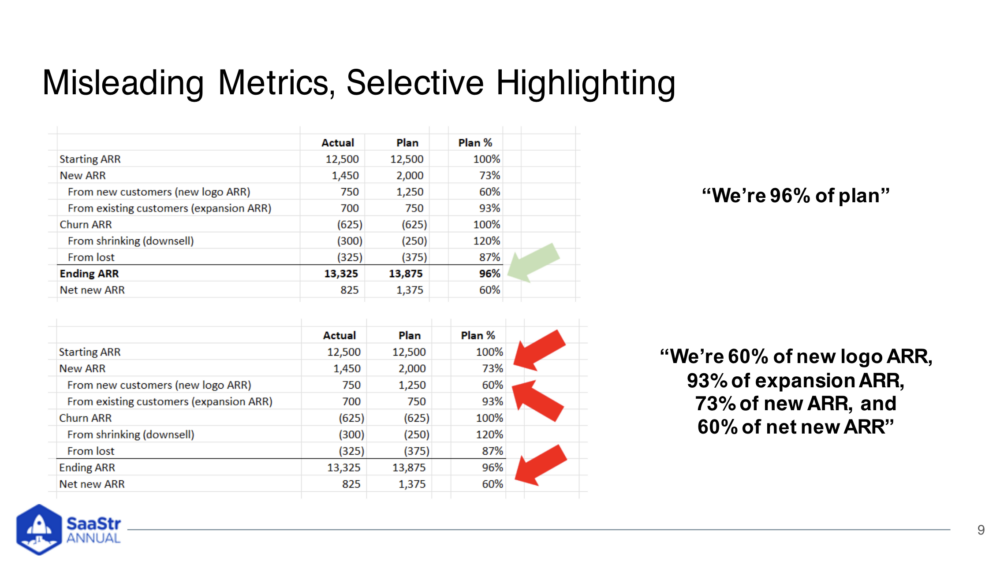
Someone could present the data here, stand up, and say we had a good quarter. We ended at 96% of the plan. But they didn’t. They used a $12.5M stabilizer called starting ARR to dampen out fluctuation and plan performance. They should be talking about 60% of new logo ARR, 93% of expansion ARR, etc. Instead of a good quarter, it was a semi-catastrophic quarter. You’re misleading by cherry-picking the good numbers. It’s a sleight-of-hand story about numbers, and it’s hiding the issue of needing to work on Net New Logo ARR.
#3: Deja vu.
You go to the same board meeting three times in a row, asking yourself if anything ever changes at this company. This isn’t a direct symptom of a SaaS metrics problem but an indirect symptom. Instead of avoiding the hard numbers, have a conversation about what is and isn’t working and set goals to work on them. Some things take multiple quarters to fix.
#4: Rat-holding.
These people try to have a conversation about business using metrics but end up talking about metrics and not the business. A CMO might come in saying they generated 1200 MQLs last quarter, yet sales feel like they’re starving. You need to define these metrics in advance so you don’t count the wrong thing.
#5: Semantics.
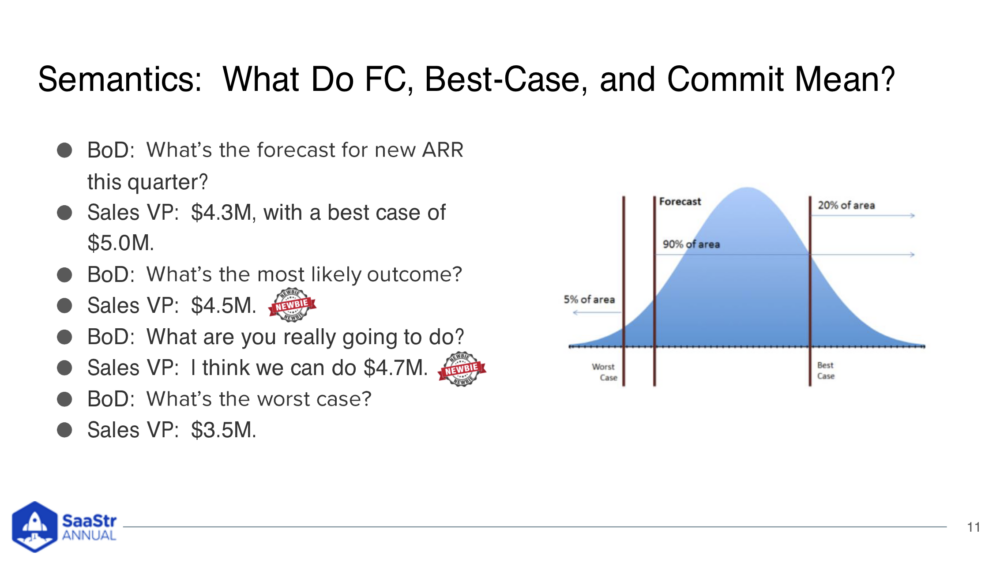
This is when you think you’re having a good conversation, yet the words don’t really mean anything in reality. For example, if you ask your VP sales for their commit and they say “$4.3M and best case is $5M” or “most likely outcome is $4.5” – so, somewhere in the middle. Problematically, $4.5M is that’s the a real answer. It may sound good, but push them to define what ‘best case’ and ‘most likely’ mean. Does it mean closing all deals in the pipeline this quarter? Does it mean bringing in X% of new business to hit that number? (See how this answer’s falling apart?)
Semantics are important – especially when reporting commits back to the business. How you really want your VP Sales to answer (and the answer you want to receive) should be the answer/number that you have a 90% confidence level in. Meaning – in this example – the VP of Sales would finally answer $3.5M because that’s what he feels 90% confident he will realistically hit.
#6: Recalculation.
Board members recalculate metrics because they don’t trust they’ll get the right answer. This is a symptom of a serious problem. You want your investors to trust the management team to present the right numbers or update the templates.
#7: Inexplicability.
The company is not performing, but the numbers don’t show why. This is a tough one, and it’s hard to diagnose when you’re behind on ARR or missing end-cash, but when looking at the metrics, everything looks fine. This does happen, and you’ll need to do a deeper dive into broader metrics to figure out what’s happening.
#8: Dissonance.
This is when the words don’t match the music. For instance, when you hear a song that sounds happy, but the lyrics are sad. If you aren’t paying attention, you miss things. Many board decks sound like this, slipping in something like a burn rate of 7x in between normal metrics. It’s a type of avoidance and is a huge problem. More on that one here.
#9: Innumeracy.
Only the CFO and ops people are allowed to present metrics. This is ultimately a cultural issue, and the symptom is simple. If you go to a meeting and only two people are allowed to answer numbers questions, you have a problem. Everyone needs to understand the metrics to help drive results.
#10: Deja Vu.
Do you get Deja Vu? Feel like you’ve been in the same board or leadership meeting over and over again? It never changes? Deja Vu with metrics occurs not when you’re making slow progress towards an incremental goal or hard problem – it means talking about the same issues or metrics, literally over and over again, with no different result or no different action.

#11: Disconnect.
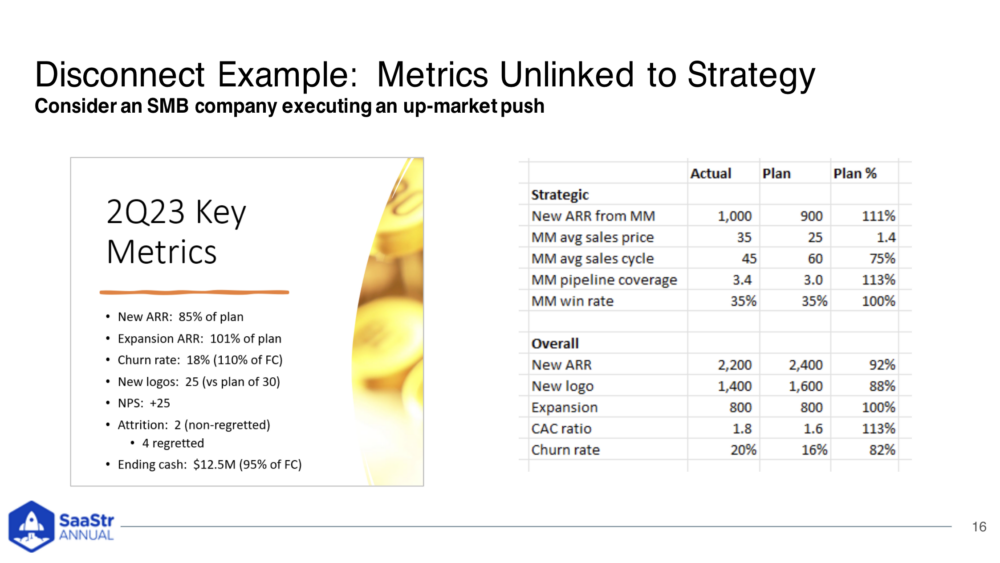
Metrics aren’t linked to strategy. In the example below, a company might present quarter metrics like the image on the left. But what they really need to present are the metrics on the right. The strategy to actually improve business is on the top, and the overall goals to run the business are seeded underneath.
#12: Piecemealing.
Numbers are evaluated in isolation, not holistically. A VC will look across their portfolio and find a company with the best CAC, another with the best CAC payback period, the best rule of 40, and then ask you to beat them on all four. That’s inherently unfair and a form of bludgeoning. We need to look at everything holistically because piecemealing can be dangerous. You’re losing insights if you look at pieces one by one.
#13: Mis-benchmarking.
This is when you are comparing to the wrong companies. It’s important to compare to others, but maybe you shouldn’t try to be in the 75th percentile across the board. Some benchmarks are highly biased. You might be comparing your company to a survey average, and keep in mind that survey might also include a bootstrapped or PE-backed company or a VC moonshot, which will grow rapidly. Instead, benchmark by aspiration. If you want to sell for 18x EBITDA, compare yourself to rather to companies achieving that goal, not the average cohort.
#14: Causality.
Correlation is often confused with causation. If the VP of Customer Success says all customers who churned had multiple escalations because they didn’t have enough agents, so they hired more agents, that might be correct. But you can’t say a simple correlation is causation. Maybe the product isn’t working, so agents are getting more calls. You need to find the underlying driver to figure out the real causation.
#15: Torture.
This is someone selecting and twisting the data to justify prior conclusions. People arrive with a hypothesis about what’s wrong with a company and have confirmation bias, so they’ll selectively choose and torture the data. The data will eventually confess anything if we’re determined enough. People do this to offset metrics.
What’s Really Going On Here?
Let’s look at five underlying problems that may be causing some of these symptoms.
- There’s no shared metrics foundation — what the metrics mean, how they’re calculated, and why they matter.
- There’s no trust — the story being told doesn’t match the data.
- Metrics aren’t integral to strategy. They’re only a financing tool, not linked to OKRs and no leading indicators.
- The culture is not metrics-driven — numeracy is a prerequisite for conversations about the business.
- Metrics aren’t being used to define the trajectory and long-term goals of the business.
A 5-Layer SaaS Metrics Maturity Model
Dave built a SaaS metrics maturity model to improve SaaS metrics. They include:
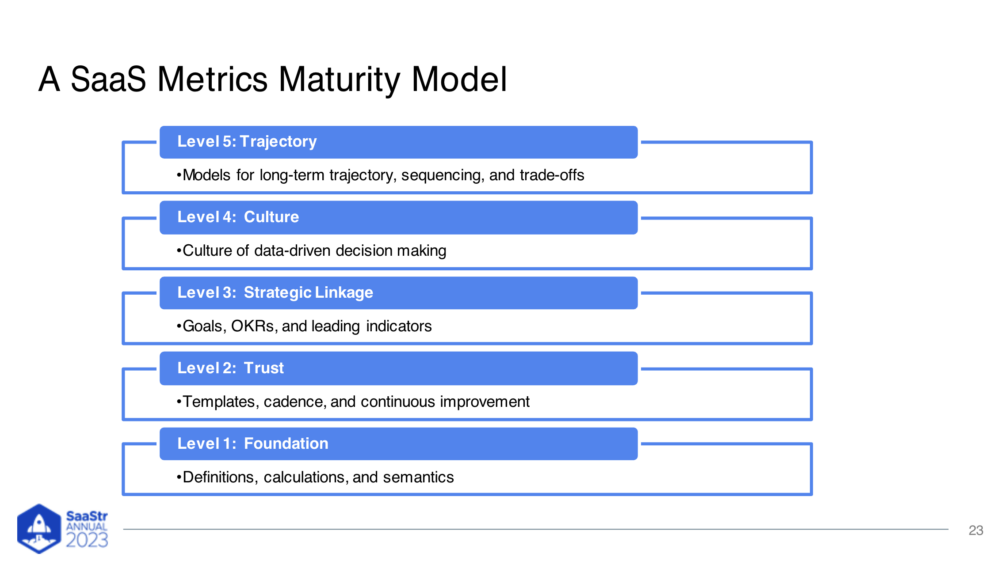
Improving SaaS metrics maturity is a journey. If you asked founders if they knew how hard it would be to build a company, would they still do it? Many would say no. You need that endearing entrepreneurial trait of the pirates and romantics to lift something this hard off the ground. It requires trust and vulnerability. So, let’s traverse the five layers.
- Layer 1: Lay the Foundation. We’ve discussed many of these points, but there are two new ones. Sometimes, it requires reworking underlying systems and offloading to a metrics committee that really wants to work on metrics. Delegate the problem to people who care, give them time, and then check-in.
- Layer 2: Build trust. Templates build trust. Why? Because there’s no cherry-picking. The most common form of misleading is cherrypicking. We leave data out. When you have templates, you can’t leave stuff out. You show everything every time, and it never changes. You can show 5 or 9 trailing quarters of history or the most recent forecast, so it’s rich in context. There’s nowhere to hide with a template, and it’s the only way to build trust. Keep working on your templates and making them better.
- Layer 3: Link to Strategy. The point of all strategy is to identify the biggest challenges and overcome them. It’s that simple. The thing operators get wrong is they have no empathy for the board. They tell them to “trust me” without giving any leading indicators or data. Trust the data.
- Layer 4: Metrics Culture. This is really a choice. The goal isn’t just to have a conversation about metrics. It’s to have a conversation about the business using metrics. A famous quote by the CEO of Netscape is, “If we have data, let’s look at data. If all we have are opinions, let’s go with mine.” If you see that enough in your staff meeting, people will show up with data.
- Layer 5: Agree on Strategic Trajectory Use models and benchmarks to establish mid to long-term agreements on what you’re trying to build. SaaS metrics can be used as tools of enlightenment or oppression. Now, you have an idea of the common symptoms of a bigger problem, why those problems exist, and a roadmap model for what you can do at each level to build SaaS metrics maturity.