A Complete Guide to Subscription Revenue Forecasting
7 MIN READ
|
Updated on March 25, 2023

Accurate revenue forecasting is crucial for every business as it informs future valuations, dictates expenses, improves conversions, and even helps navigate economic uncertainty.
However, accurately predicting revenue can be challenging, particularly for subscription-based businesses, as they need to account for churn, revenue leakage, and upgrades/ downgrades across their billing engine, or marketing and sales pipeline, adding complexity to the whole process.
So how can you forecast revenue accurately for a subscription-based business?
In this article, we’ll answer that and help you understand the different metrics and factors to consider when making a subscription revenue forecast to help you make more informed decisions.
But first, let’s start with the basics.
Subscription revenue forecasting is the process of predicting future revenue. It uses historical data to estimate how much money a company will bring in over a specific period — monthly, quarterly, or annually.
It helps businesses plan for the future by providing insights into expected revenue streams. It also helps businesses identify potential roadblocks to achieving revenue targets, allowing them to make adjustments to their strategy.
A common mistake businesses make while forecasting revenue is measuring every metric they can. But measuring too many metrics can result in data overload and make you lose sight of the bigger picture.
Let’s look at the key business metrics you must track to create an accurate forecast.
Average Revenue Per User (ARPU) is your company’s revenue over a defined period (typically per month or year) for each active customers
Here’s the formula to calculate your ARPU:
ARPU = Total revenue / Active customers
For example, if you generated $100,000 and had 500 customers, your ARPU would be $200.
Monthly Recurring Revenue (MRR) is your company’s predictable monthly revenue. It includes recurring charges from coupons, discounts, and add-ons but doesn’t include one-time charges like setup fees.
Here’s the formula to calculate your MRR:
MRR = ARPU x Number of subscribers
For example, if your ARPU is $200 and you have 100 paying subscribers, your MRR would be $20,000 (200 x 100).
Churn rate is the rate at which your company loses customers — either voluntarily when a customer cancels their subscription or involuntarily if a customer’s payment attempt fails.
Here’s the formula to calculate your churn rate:
Churn rate = [Total churned customer for the period/ Customers at the start of the period] x 100
For example, if you had 100 subscribers at the beginning of the month and 15 subscribers have churned your churn rate would be 15% ([15 / 100] x 100).
Customer Lifetime Value (CLV) estimates the total revenue a subscriber will bring to your business over the lifetime of their account. It allows you to forecast the value of new and existing subscribers. This metric is essential for revenue forecasting as it helps businesses understand the long-term value of each subscriber.
Here’s the formula to calculate your CLV:
CLV = ARPU / Churn rate
For example, if your ARPU is $200 and your churn rate is 15%, your CLV would be about $1,333 (200 / 0.15). Comparing your CLV to your Customer Acquisition Cost (CAC) will help you determine how much you should spend on acquiring customers to maintain profitability.
While we’ll discuss how to forecast subscription revenue the traditional way in detail, you can check out our MRR calculator that will automatically forecast your MRR for the next 12 months. All you need to do is enter the following metrics:
Here’s what the MRR projection will look like:
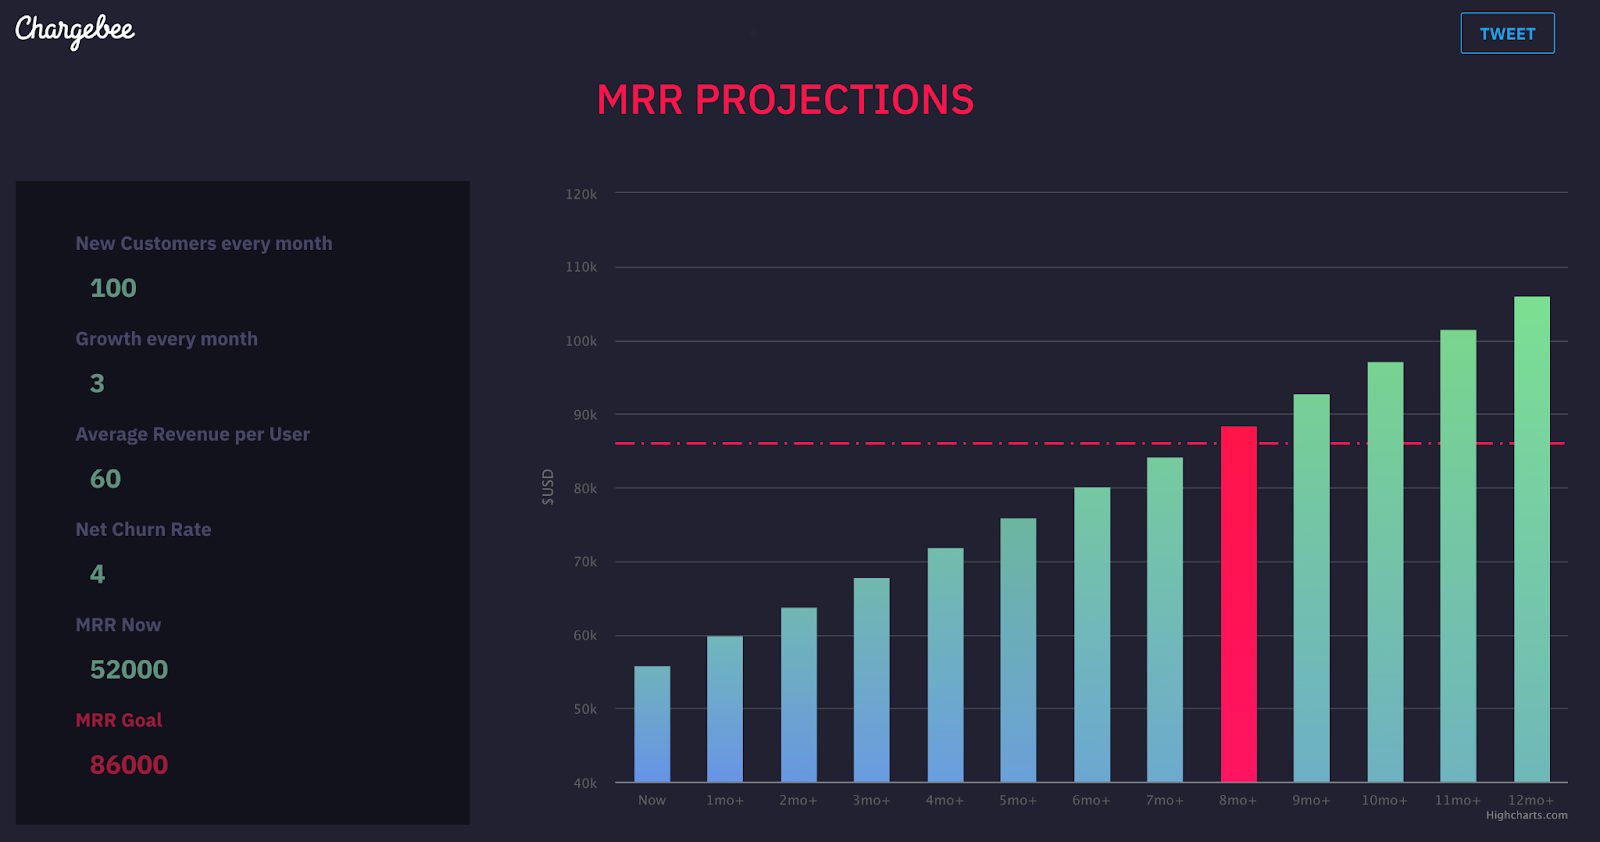
You can also add an MRR goal; the calculator will show you an estimate of when you’ll hit it.
Now let’s discuss the steps to forecast subscription revenue using a spreadsheet.
The first step is to create a subscriber forecast, i.e., an estimate of how many subscribers you’ll have over a period of time. To do this, collect data on your current subscribers and how they’ve grown over time.
Let’s assume you have the following figures:
Use the following formula to calculate your monthly growth rate for new acquisitions:
This would give us a monthly growth rate of 10%.
Now let’s plug these numbers into a spreadsheet:
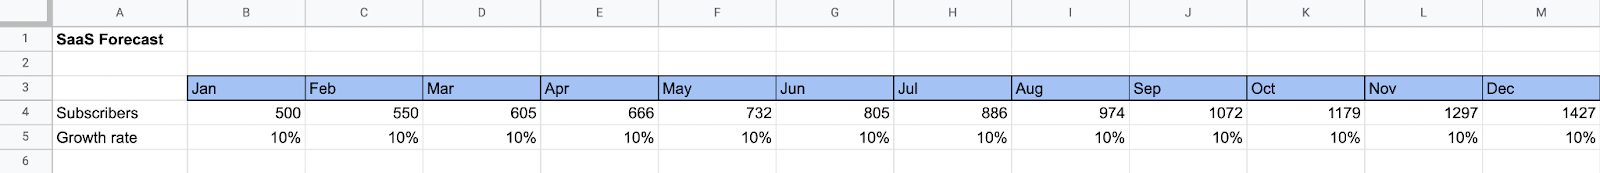
Here’s the formula used in C4 cell to calculate the subscriber count for the month of February:
C4 = B4* (1 + B5)
Enter your current subscriber count in cell B4 and the growth rate that we previously calculated in cell B5.
If you had 500 subscribers in January, you could expect over 1,400 subscribers in December based on a 10% subscriber growth rate. Of course, this assumes that every subscriber will stay with your company (which just doesn’t happen). The formula doesn’t account for churn rate, which we’ll cover next.
Let’s assume that your customer churn rate is 5%.
Here’s what the spreadsheet looks like now:
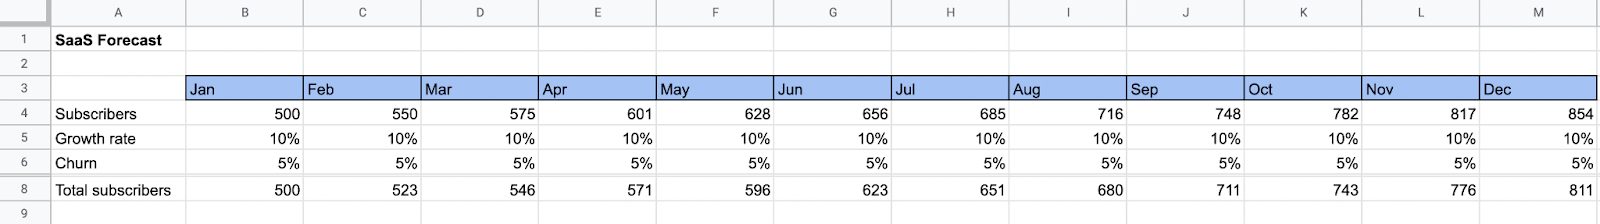
Here’s the formula in the C8 cell, which calculates the total number of subscribers:
C8 = C4* (1 – C6)
Factoring in your customer churn rate gives you a more accurate forecast of how many subscribers you should have by the end of the year.
If something is amiss, it’s worth digging into your sales acquisition strategy or pipeline to discover why.
Let’s say that your ARPU is $200.
Multiply the number of subscribers by your ARPU.
Here’s what our spreadsheet looks like now:
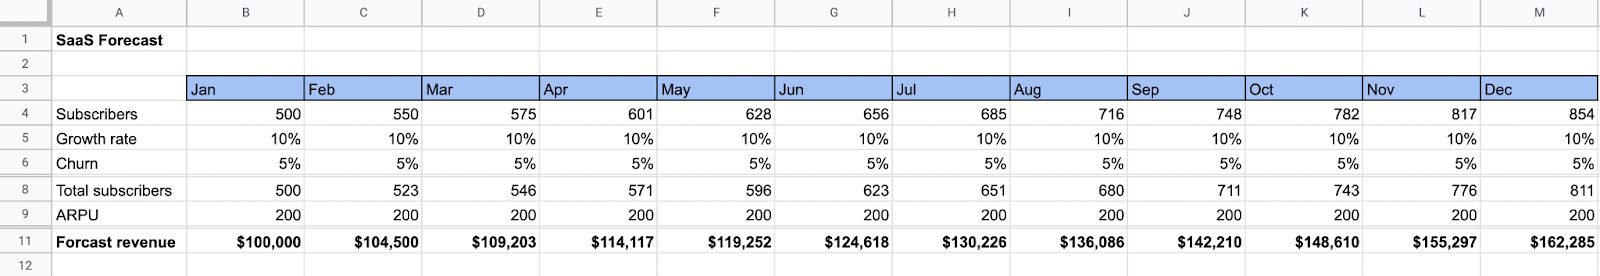
Here’s the formula in cell C11, which forecasts revenue for each month:
C11 = C8 * C9
We started the year with $100,000. Based on a 10% growth rate and a 5% customer churn rate, you can expect to end the year with over $162,000 in monthly recurring revenue.
Forecasting subscription revenue is more nuanced than simply plugging some numbers into a spreadsheet. Consider the following factors while you forecast your subscription revenue:
Earlier, we gave an example of calculating your monthly growth by taking data from two recent months and calculating the percent increase.
Of course, your monthly growth rate will fluctuate over time, so it’s important to look at historical performance when creating your forecasts.
If you have enough data, a better (and more accurate) way to estimate your growth rate is to calculate your compounded annual growth rate (CAGR) for the past 12 months.
Here’s the formula to calculate your CAGR:
CAGR = (Final month value / Initial month value) ^ (1 / 12) – 1
For example, if you had 10,000 at the beginning of January and 25,000 at the end of December, your CAGR would be about 8%. (Tip: Use a CAGR calculator to help with this calculation.)
Another factor that will affect your forecasts is your sales pipeline. If your sales team falls behind their quotas, your projections will likely be affected in the coming months.
Keep a close eye on your pipeline to identify and minimize risks. For example, a low conversion rate might indicate that the marketing team isn’t correctly qualifying incoming leads. Get to the root of the issue to get back on track.
Other factors that can affect your forecast include market forces and competitors.
A downturn in the economy (or a global pandemic) may cause companies to reevaluate their subscriptions to cut down on costs. If your software didn’t make the cut, you could see your customer base dwindling.
Increased competition can also take away valuable market share. Likewise, if a competitor releases compelling features, that could be enough to get customers to switch over.
However, the right customer retention strategies can help reduce churn and turn users into lifelong customers.
It’s important to consider customer behaviors when forecasting subscription revenue. One way to do this is to perform a cohort analysis — segmenting users into groups based on common behaviors and traits.
For example, if your data shows that users who haven’t logged in to their accounts for three months are likely to churn, you might create a cohort with those users. This allows you to predict their likelihood of churning so that you can adjust your forecast accordingly.
Subscription revenue forecasts are valuable tools that business leaders can use to make better decisions in practically every business area. Of course, you’ll need accurate data and key metrics reporting to help with your forecasting.
This is where Chargebee’s RevenueStory comes in.
RevenueStory is a subscription analytics platform that gives you a 360-degree view of all the key metrics you need to create accurate forecasts and make data-backed decisions to keep your business aligned with growth.
With RevenueStory, you can:
And a lot more.