A Plug-n-play SaaS Financial Model Template and How to Use It
6 MIN READ
|
Updated on March 13, 2023

Done right, a SaaS financial model can be a very useful tool for strategic CFOs and finance leaders to make data-driven decisions and demonstrate future growth to internal and external stakeholders.
Irrespective of the growth stage you’re in, SaaS companies need financial models to drive insights from the company’s financial statements so that they can balance growth versus costs and forecast future revenue.
Before we get to the template, there are nuances to a SaaS financial model that one must understand.
Simply put, SaaS financial modeling is a process of charting a summary of the expenses and revenues of your SaaS. It also includes present and future revenue forecasts and important KPIs that a finance leader must keep track of.
While traditional financial models might include these elements for a single product revenue projection, SaaS financial models must factor in the complexities of recurring revenue that comes in with subscriptions, churn, and the impact it has on predicting future revenue.
SaaS businesses typically incur high costs in their early stage, when the focus is on acquiring new customers. Since the revenue is accrued over a period of time, it is critical to track customer retention and reduce customer churn for SaaS businesses.
That’s why it is critical to use financial models that are tailor-made for the nuances of the SaaS business model.
There’s much more to efficiently running a business than having an understanding of your financial statements.
To earn a seat at the table and drive strategic growth, modern finance leaders must surface valuable insights that help leaders connect the dots internally. With a robust SaaS financial model in their arsenal, finance leaders can leverage data-driven insights to shape business strategy and the growth path for their company.
A SaaS financial model is important because:
And with that, let’s begin with understanding the key components of a SaaS financial model and an excel model template we have prepared for you.
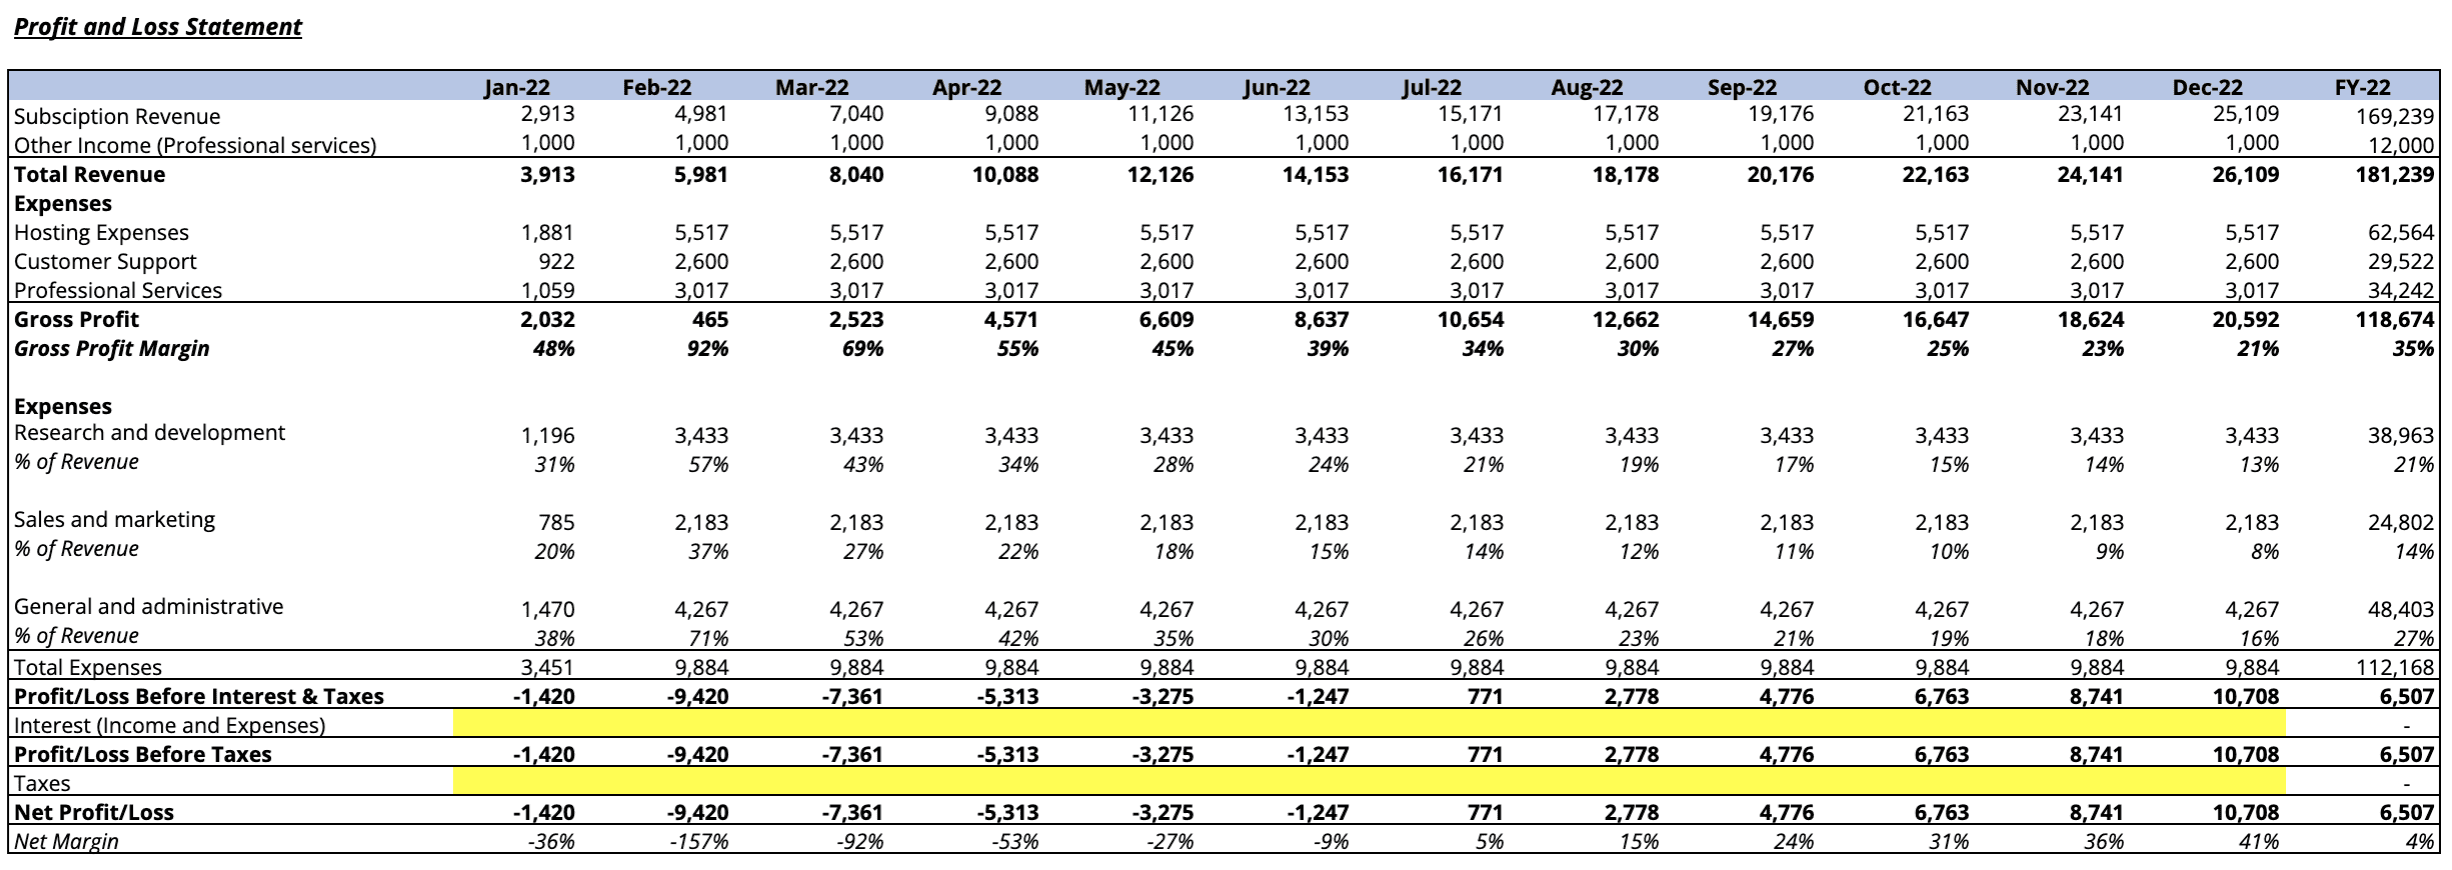
The Profit and loss (P&L) report summarizes the cash flow statements and balance sheet of a company during a specified period. This report can act as the single source of truth to assess the financial health of a business and can be used to create viable financial plans.
From the P&L statement, you get a picture of expenses, profits before taxes, and ultimately, your gross profit.
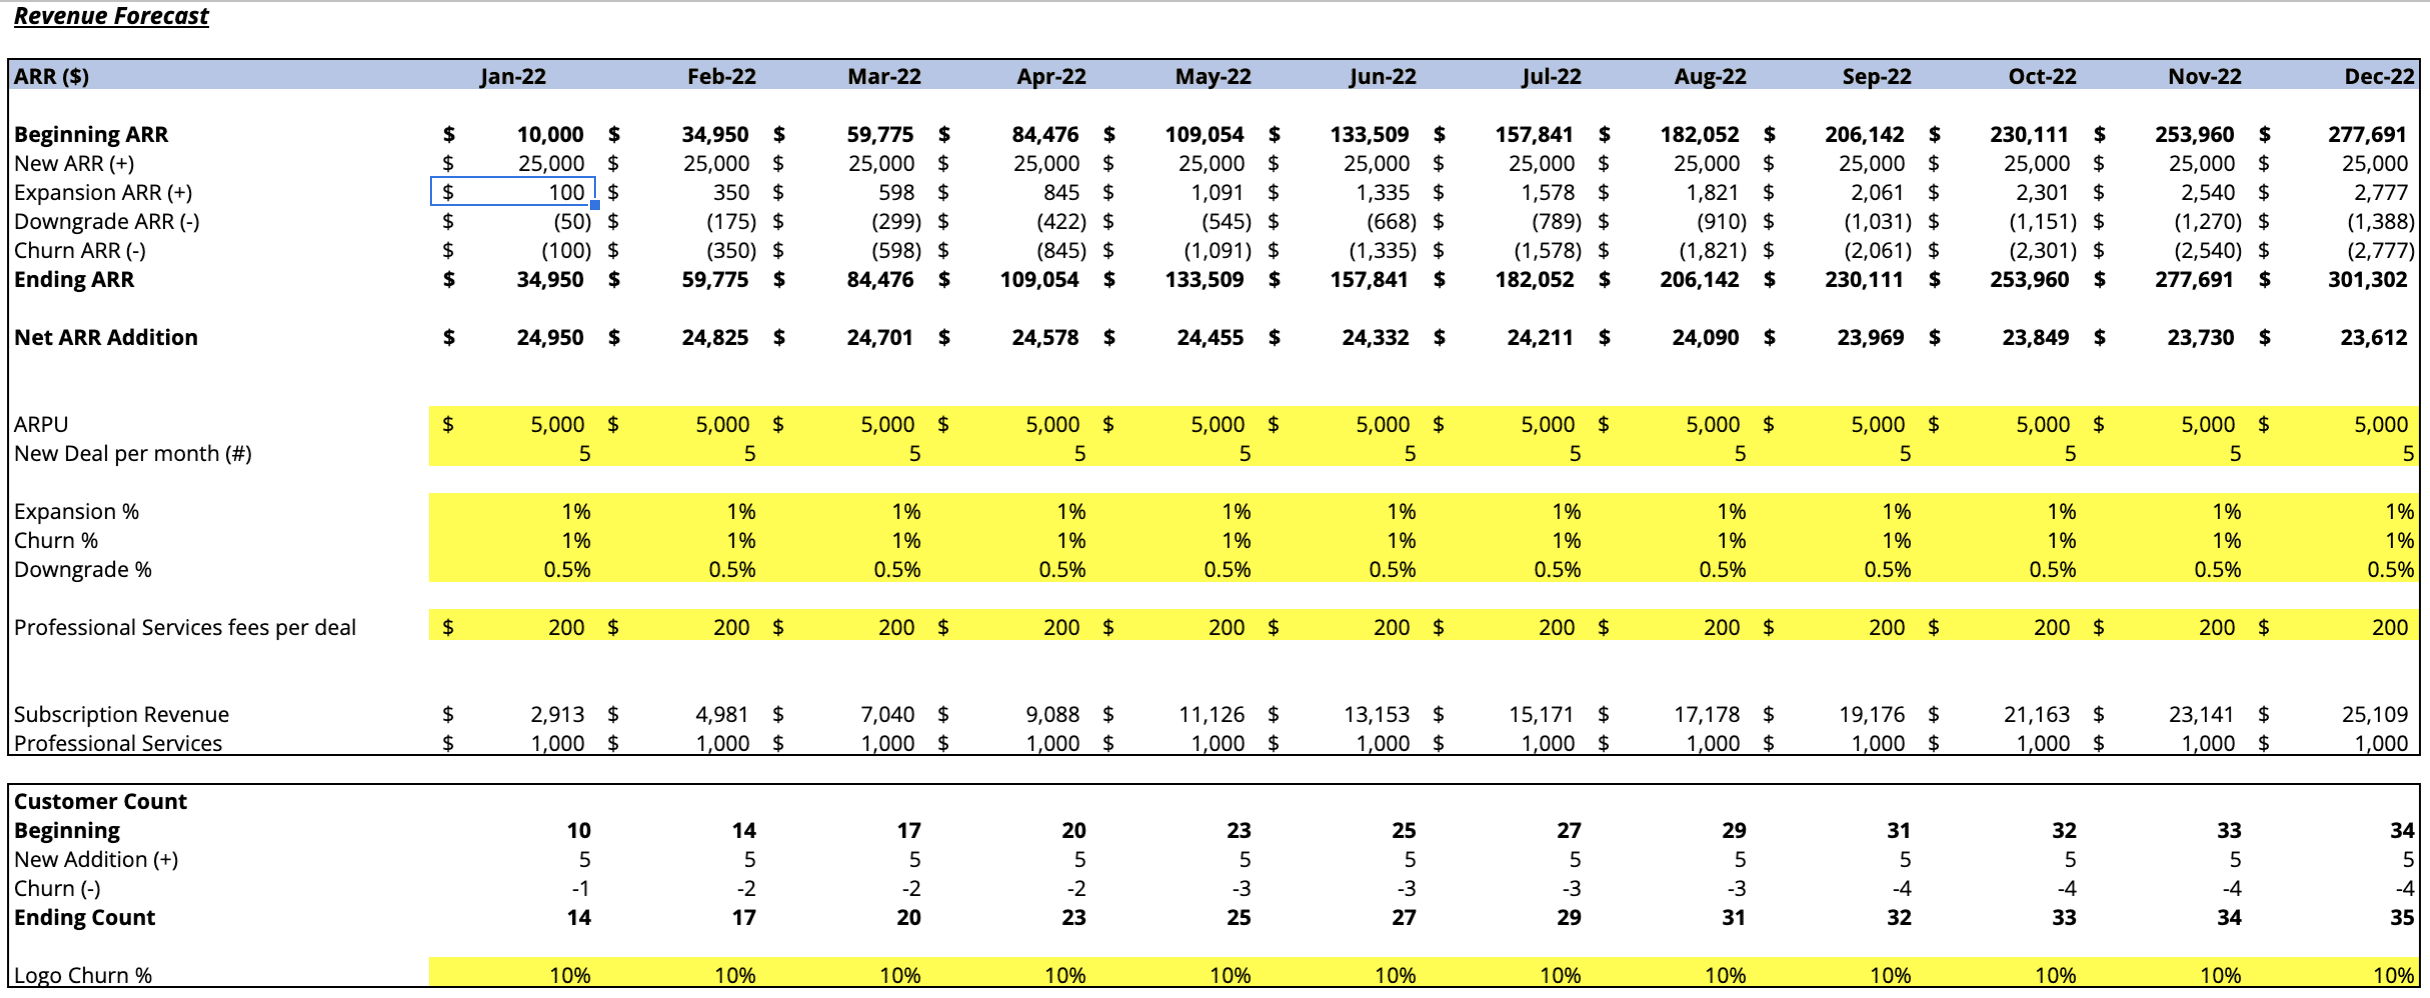
This is where you track your recurring revenue: Annual Recurring Revenue (ARR) and Monthly Recurring Revenue (MRR). Common elements of this report include new MRR, expansion MRR, downgrade MRR, and churn MRR.
This report gives you an idea of revenue at the end of every month and also the % logo churn that has occurred.
The forecasting model can be used to create financial projections to predict future revenue growth for your SaaS.
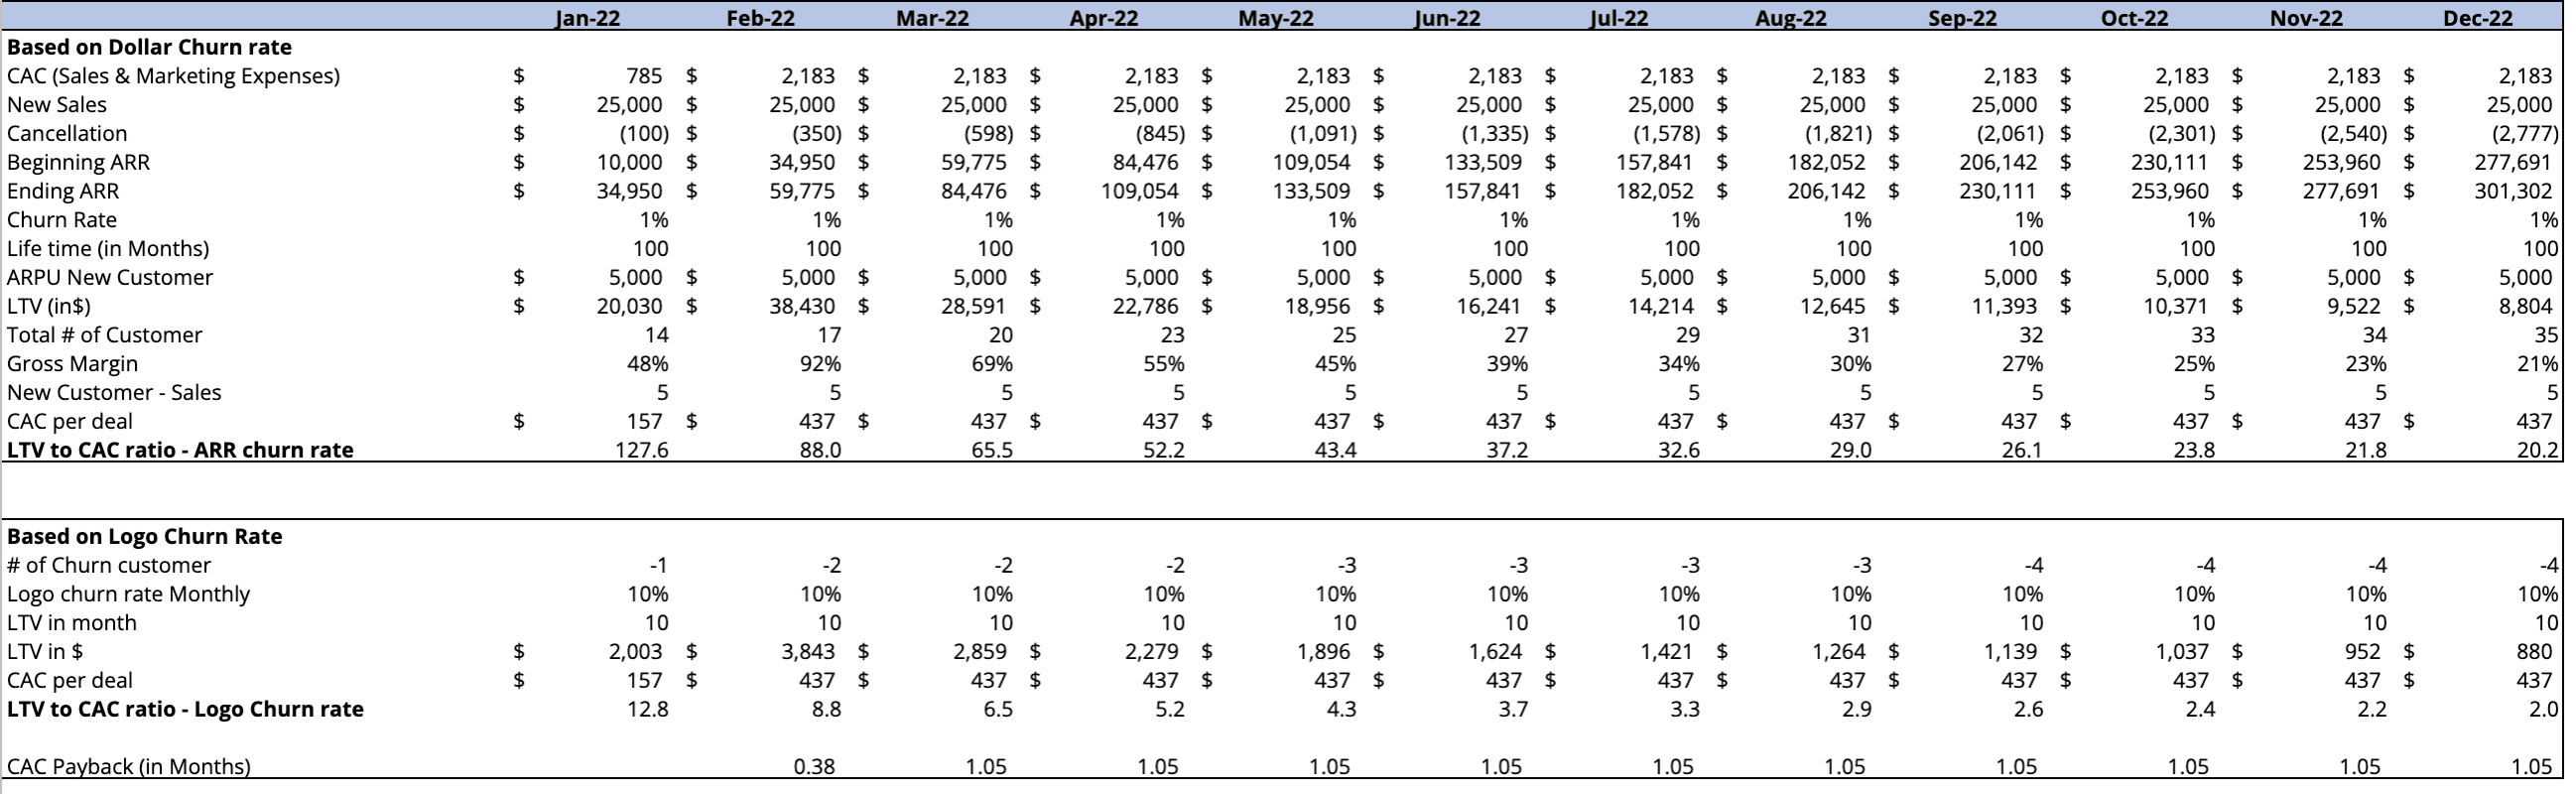
Unit economics express a company’s costs and revenue on a per-unit basis. The importance of unit economics stems from the fact that it helps calculate profitability at the unit level, making it fundamental to most pursuits of growth and profitability. If you are profitable per unit, you must be profitable overall. So understanding unit economics also allows a business to make informed decisions with cost in mind. For example, we have Customer Acquisition Cost (CAC), Customer Lifetime Value (CLV), the CAC:LTV ratio, and the CAC payback period. These metrics act as crucial indicators in the efficiency of your SaaS operations and any SaaS business worth its salt should definitely keep its eye on them.
Our plug-n-play excel template for SaaS financial model is fairly easy to use. Here’s a complete walkthrough of the template.
Download the free template by clicking here.
There are some key points to remember when you begin using the template. The yellow cells are where you input your company’s numbers in order to populate the rest of the report. Here’s a step-by-step guide to using the template:
Revenue Report:
P&L Statement:
Well, this template can be used by early-stage SaaS and well-established businesses alike. Finance leaders such as CFOs or financial controllers can make use of this template to draw valuable inputs while strategizing for a business plan or even while projecting growth to stakeholders during fundraising.
Is this template useful? Yes. But is it scalable for SaaS businesses with high growth rates? Not so much.
With growth, come complexities. As you scale, your SaaS might offer multiple product lines, expand to multiple geographies, and experiment with different pricing models.
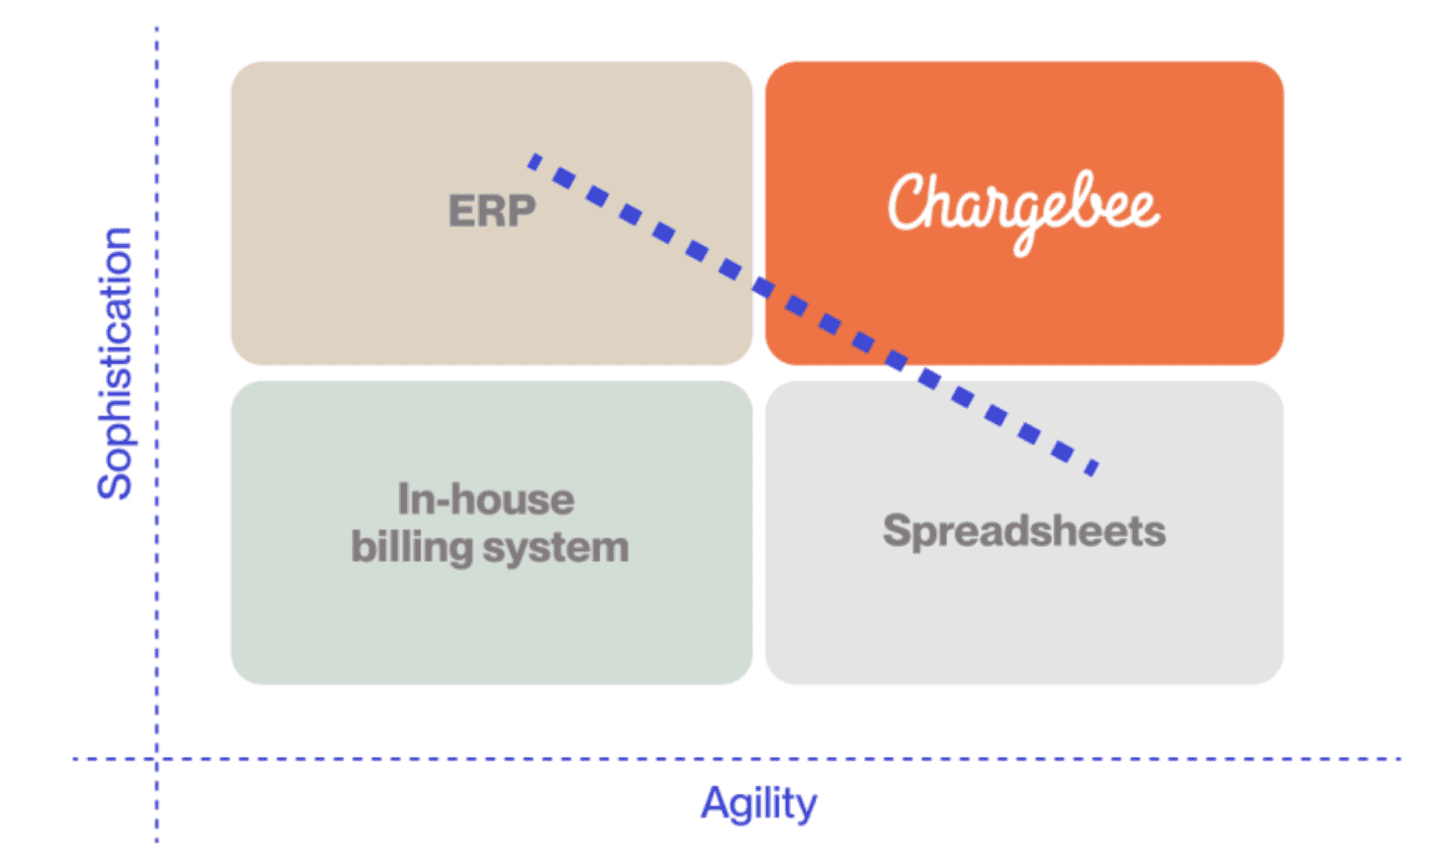
A single-sheet financial forecast can no longer catch up with your growth ambition. Our SaaS Finance Ops Maturity Model clearly outlines the indicators that you may be outgrowing your tech stack and what you need to upgrade to prepare for the next stage of growth. Declining efficiency in your acquisition channels, increasing revenue churn, compounding manual errors, and rising costs of expansion are all indicators that your tech stack needs a change.
That said, you need not sacrifice your agility at the cost of sophistication. And that’s why you need a scalable revenue infrastructure like Chargebee that lets you stay nimble as a startup while you soar new heights to achieve enterprise-like sophistication.
Setting up a fully functional financial model for SaaS is not easy, but this excel template will help you get all the necessary outputs required for you to make sound decisions. However, spreadsheets are not scalable as you grow rapidly, and you must evolve your tech stack to match your ambition.
Chargebee’s RevenueStory gives you the reporting capabilities that match your growth aspirations. Check it out here!