How to Perform Funnel Analysis in Userpilot: Step-By-Step Guide (+Use Cases)
Curious to learn how to perform funnel analysis in Userpilot?
This article provides an in-depth guide with helpful visuals to guide you through all the important steps. You will also see common use cases where Userpilot’s funnel analysis tools come in handy.
TL;DR
- Funnel analysis is a way to visualize and understand how users flow through your website or app. There are different funnels—sales funnel, onboarding checklist funnel, free to paid conversion funnel, and so on. What you choose depends on what you need to track.
Proper funnel analysis helps you:
- Measure campaign effectiveness.
- Make data-driven decisions to boost your conversion rate.
- Spot friction in your user journeys.
- Retain users.
A step-by-step guide to performing funnel analysis in Userpilot:
- Map out each stage in the user journey.
- Specify the metrics to monitor for each stage.
- Create a new funnel report in Userpilot.
- Customize your funnel analysis parameters.
- Add filters to extract insights for various user personas.
- Choose your visualization.
- Pair your analysis with heatmaps and session recordings to get actionable insights.
Use cases for Userpilot’s funnel analytics tools:
- Design a smooth onboarding process to help users easily adopt your existing and new features.
- Improve your trial users to paying customers conversion funnel.
- Track user behavior for multiple personas.
- Monitor the time to convert for each conversion funnel.
- Identify drop-off points in the customer journey.
- Track period-over-period analysis for your funnels.
- Ready to start collecting funnel analysis data? Book a demo to see how Userpilot helps product managers (and SaaS teams in general) collect and interpret funnel data.
![]()
Try Userpilot and Take Your Product Analytics to the Next Level

What is funnel analysis?
Funnel analysis is a way to visualize and understand user flow through your website or app. The primary goal is to identify where they drop off and fail to complete a desired action (such as signing up, completing onboarding steps, or upgrading their accounts).
The concept gets its name because the number of users progressing through the steps usually gets smaller, resembling a funnel shape.
What are the benefits of funnel analysis?
Equipped with funnel analysis tools like Userpilot and Google Analytics, you can conduct in-depth analysis and generate insights that enable you to:
- Measure campaign effectiveness: By tracking key performance indicators (KPIs) such as click-through rates (CTRs), conversion rates, average session duration, activation, and adoption, you can gauge the effectiveness of your messaging and overall campaign success. This granular data will help you identify high-performing campaigns and those that may require a shift in strategy.
- Make data-driven decisions: The data from conversion funnel analysis helps you make informed decisions that align your product roadmap with user needs. For instance, if the report shows many users prioritize a specific feature, that’s a sign that they enjoy the problem it helps them solve—you can focus on building similar features or refining the existing one to serve users better.
- Spot friction in your user journeys: Funnel reports pinpoint exactly where users struggle or drop off. For example, a steep abandonment rate on a payment page or an onboarding step indicates friction. Once you spot the friction points along the customer journey, deploy in-app flows to provide guidance and ensure a smoother user experience.
- Retain users: By understanding the customer journey and improving it, you can increase satisfaction and engagement for your key features. Happy users are more likely to stick around, reducing churn and fostering a loyal user base.
A step-by-step guide to performing funnel analysis in Userpilot
Let’s see how Userpilot makes funnel analysis a walk in the park.
Follow these simple steps to conduct your first analysis.
1. Map out each stage in the user journey
Determine the user journey you want to analyze (e.g., user onboarding, new feature adoption, or free-to-paid conversion). Then, document each step in that journey and what the user does in each stage.
For example, the free trial to paying customers journey will include the following steps:
- Created a free trial account
- Completed onboarding
- Used primary features
- Used secondary features
- Upgraded to a paid plan

2. Specify the metrics for your data analysis
For each stage of the customer journey you’ve mapped, identify specific KPIs that will help you measure success and identify friction points. Common metrics include customer acquisition cost, time to value, breadth of use, and revenue per user. The metrics you track largely depend on the customer journey stage you’re analyzing.
For example, if you’re measuring the acquisition funnel, you have no business checking revenue per user yet. You’ll be more interested in metrics such as free trial sign-ups, demos, and PQLs (product-qualified leads).
Here’s a snapshot of the complete customer journey and metrics to track at each stage:

3. Create a new funnel report in Userpilot
Log into your Userpilot account. Navigate to the Analytics module and click on the Funnels option.

This action will create a blank report. Now, here is where we input our parameters.

Input the stages of your user journey as you’ve mapped them out. Start by adding the first stage of the journey and continue adding till the last stage. Name each stage and define the events that qualify a user as having completed that stage (e.g., “Signed Up,” “Completed Onboarding”).
Depending on what you’re tracking, you can even add page visits or survey responses as part of the events you’re tracking.

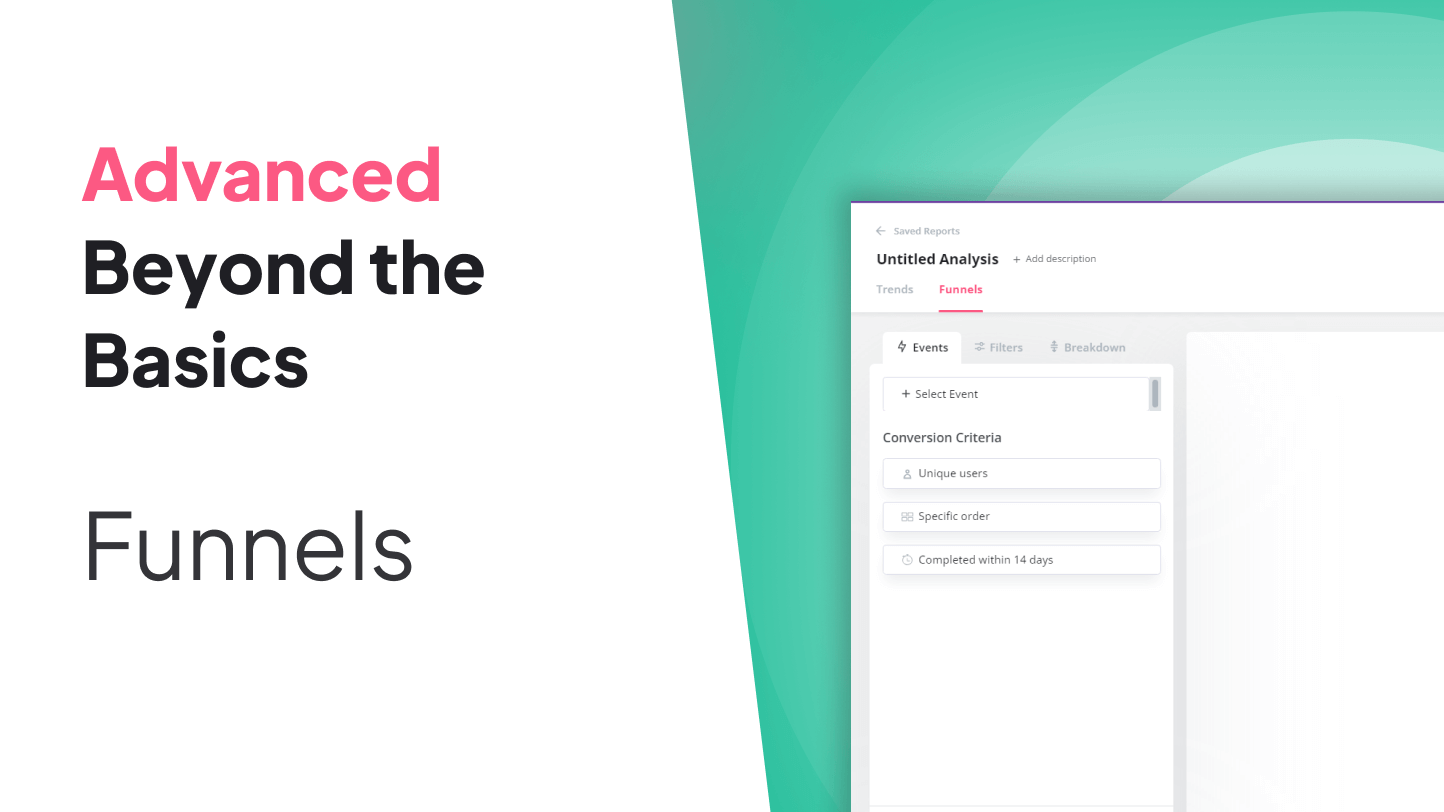
4. Customize your funnel analysis parameters
Pick your conversion criteria based on the following:
- Unique users/companies: Choose whether to generate your funnel analysis report based on individual users or companies.
- Specific order: Specify whether the order of events is relevant to your data analysis. You can choose to see the results based on the specified order or based on any order.
- Conversion time: Specify how long it should take for a user to complete the steps.

Click “Run Query” once you’re done selecting the events and conversion criteria. This action will create and begin populating the funnel with user engagement data.
You can view your funnel reports in different timelines depending on what suits your tracking and funnel optimization needs. Choose any of the following from the drop-down menu:
- Last 7 days
- Last 14 days
- Last month
- Last quarter
- Last year
- Custom date

5. Add filters to extract insights for various user personas
Data filtering allows you to run reports for different personas and use cases. This is important because segmentation lets you derive specific insights for your audience types and lets you make data-driven decisions.
You can filter by user properties, company properties, or segments. Examples of properties to filter include name, email, sign-up date, web sessions, and the like. For segments, think of custom user segments you create yourself (such as new users that came through different marketing channels).

You can add breakdowns to get more granular with the conversion funnel reports. For example, you can track funnel drop-offs for each device type with a single report.

6. Choose your visualization
How would you like your data displayed, and what aspects of the conversion journey are you interested in tracking? Userpilot offers a variety of options.
You can choose from:
- Conversion steps: This shows a bar chart with users progressing through each step. It enables you to quickly visualize the results, spot high and low engagement events, and make decisions.

- Conversion trends: This chart type displays results in a line graph to enable you to see user behavior trends and note changes in conversions.

- Time to convert: This is also a line graph, but this time it shows you the total time it takes users to convert. By seeing the average conversion time and how many users are falling within that range, you can determine if your flow has friction.

- Metric: This report shows the funnel performance as a single metric. It’s particularly useful when you need to track the conversion rate and the total time to convert.

7. Pair your analysis with heatmaps and session recordings
Funnel analysis helps point out where the problem lies. Drive deeper insights with qualitative analysis tools like heatmaps and session recordings to understand exactly what’s causing friction.
Heatmaps allow you to see how users interact with your product. From the reports, you can note which areas get the most engagement and which areas get low engagement and understand whether your UX design is contributing to high or low engagement.

On the other hand, session recordings let you see videos of how users engage with your product, including all the clicks, scrolling, and hovers they do. As you watch the recordings, you can see moments of indecision or areas of confusion.
Session recordings will be available in Userpilot by the end of Q1 2024. For now, here’s an example so you see the sort of value you’ll be getting from this report:

Use cases for Userpilot’s funnel analysis tools
If you’re wondering how Userpilot’s funnel analysis tools can help your company, here’s a breakdown.
Design a smooth onboarding process for new users
Monitor how users progress through each stage of the onboarding flow. You can track metrics such as time to convert, user engagement duration, where they get stuck, and how soon they complete the onboarding flow.
Analyze the onboarding funnel to identify friction points and take steps to help users explore your tool better. Userpilot can also help you create the guides you need to eliminate friction.

Improve your trial users to paid users conversion funnel
Many SaaS companies struggle to convert trial or freemium users.
Implement funnel analysis to monitor how many trial users enter your funnel and what percentage of that you converted.
Then, dive deeper to identify why some converted and others didn’t. Remove any friction that’s causing the drop-offs. Also, study your converted users to glean insights you can use to build better product experiences and increase the conversion rate.

Track user behavior for multiple personas
As you’ve seen earlier, Userpilot’s funnel analysis feature lets you filter data based on different criteria, including varying personas.
By segmenting the data this way, it becomes easy to understand the conversion trends for each segment. You can then design customized product experiences to meet each persona’s needs, boosting engagement and retention.
Monitor time to convert for each funnel
By tracking how long it takes users to progress from one stage of the funnel to the next, Userpilot helps you identify stages where users may be hesitating or dropping off.
This information is critical for streamlining the conversion process, whether it means optimizing free trial duration, providing additional onboarding information, or removing unnecessary barriers.

Identify drop-off points in the customer journey
One of the biggest advantages of funnel analysis is that it allows you to identify where users are dropping off in your journeys.
Once you have your funnel report, simply hover over the drop-off range to see how many users are abandoning the process and where.

Track period-over-period analysis for your funnels
Lastly, Userpilot allows you to track how your conversion rates and drop-offs have changed over time.
Essentially, you’re comparing the current period with a previous period (e.g., YoY, MoY) to see if you’re improving and generate insights to do better.
It’s easy to do this when your report is ready; just click on the “Previous Period” button to see data for the previous period for comparison.

Conclusion
Funnel analysis is a powerful way to learn more about your users and gather insights to improve the overall user experience. Tracking drop-offs helps identify friction so product teams can take the necessary steps to remove it from the user experience.
Want to get started with funnel analysis in Userpilot? Book a demo now to begin.
Try Userpilot and Take Your User Experience to the Next Level

