
Table of Contents
The main benefits of categorizing your SaaS company’s expenses are more accurate metrics and forecasts, and getting a better understanding of your company’s overall spending.
This is a v2.0 of my original post published on Baremetrics, converted and updated to a series of articles. The “rules” haven’t changed since last year, but we have gotten a lot of questions as to how to apply the rather generic advice in practice. This series attempts to give practical advice to SaaS CEOs and Founders on how to organize and automate their financial backend, giving them freedom to spend time with more value-adding parts of their business like financial planning.
After reading each post, you should be able to add your own comments and forward the article to your Accountant or Director of Ops for implementation.
Here’s an overview of the series:
- Part 1: How to Categorize Expenses in a SaaS Startup v2.0
- Part 2: How to Automate your SaaS Expenses – Payroll with Gusto and QuickBooks
- Part 3: How to Automate your SaaS Expenses – QuickBooks Bank Rules
- Part 4: How to Choose SaaS Billing Software
This post – Part 1 – focuses on how to categorize your SaaS expenses properly by using QuickBooks or Xero, and what are the benefits of doing so.
Benefits of using Expense Categories in SaaS
The main expense categories for any SaaS company are:
- Cost of Revenue
- Research & Development
- Sales & Marketing
- General & Admin
These four categories are the standard for describing costs and expenses of any SaaS company from Salesforce to Zoom to your startup. Yet it never ceases to amaze me why so many accountants insist on creating their own set of categories, leaving you to figure out how to calculate your Gross Margin or CAC – without knowing what are your Cost of Revenue or Sales & Marketing costs to begin with.
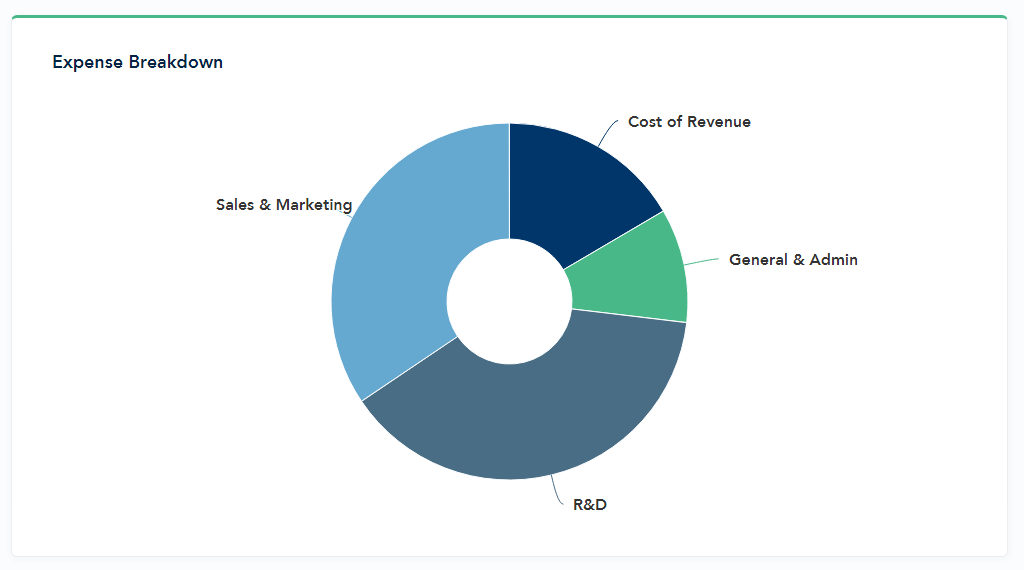
To illustrate this better, take a look at the expense breakdown below for a made-up $6MM ARR SaaS company.
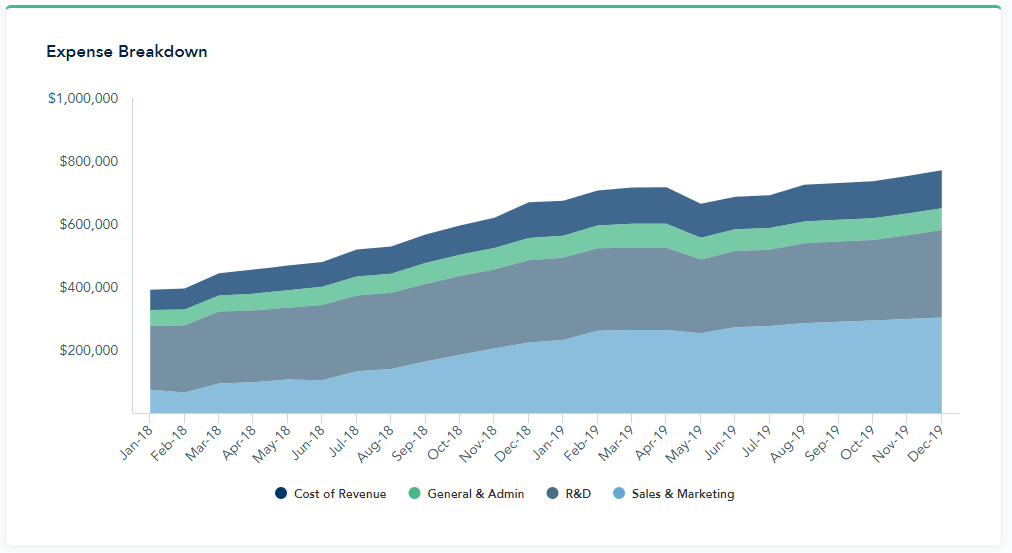
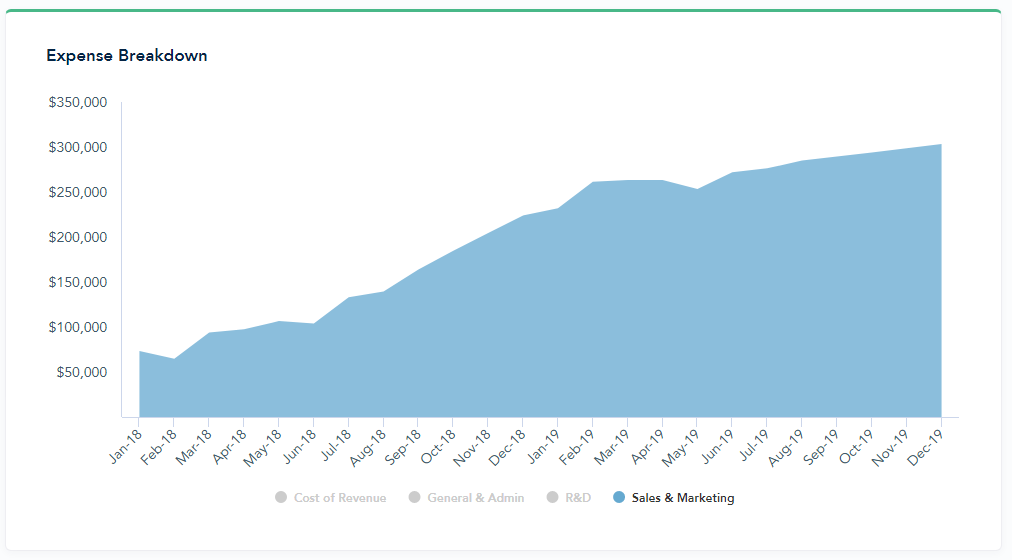
The company grew their total spend from $390k/mo to $750k/mo during 2018. Even without any breakdowns, obviously the CEO was fully aware of the company’s increased spending in sales and marketing. Indeed, if you blow up their Sales & Marketing spend below, you can see how their S&M spend was driving half of the expense growth.
What might have been less clear for the CEO is whether this spend has been sustainable. What’s their new CAC Payback Time? CAC:LTV? New Gross Margins? I personally find it surprising that a SaaS company’s forecast may often include such an expense breakdown – as it should – but the company’s actuals are a mere black box.
Cost of Revenue
Let’s start with your Cost of Revenue.
There’s somehow always the “question” of what goes into SaaS Cost of Goods Sold, as if there’s plenty of room for interpretation. Jason Cohen breaks down the question in his Quora post. The gist of it is that Cost of Revenue includes costs that go into providing your Software as a Service.
While not a GAAP-metric, it’s widely adopted and understood (examples here, here and here). You’ll need Cost of Revenue to calculate your Gross Margin, which in turn you need to calculate Customer Lifetime Value (LTV), Customer Acquisition Cost (CAC) Payback Time and to understand your company’s unit economics in general.
Cost of Revenue Examples
- Hosting
- AWS / Google Cloud / Azure
- Payroll – Customer Support
- Service Delivery Costs
- Twilio, Sendgrid
- Merchant Fees
- Stripe, Braintree
- You should also include software that helps your support team, such as Help Scout, or your Devops, such as CircleCI. It’s up to you if you want to group up all software in one category under Cost of Revenue, or several software categories under hosting, support, and service delivery.
Cost of Revenue – QuickBooks Setup
Now, you need to take this from the high level into action.
Open QuickBooks Online, and navigate to Accounting on the left sidebar. Your company’s Chart of Accounts will open up, which is just a fancy name for a list of all of your expense categories (=accounts).
We’re using a SaaS-specific term Cost of Revenue, but QuickBooks and many traditional businesses call this category Cost of Goods Sold. Keep an eye on the Type column, and scroll down to see what do you currently have stowed away in there.
Start by creating a new account from clicking the button New on the top-right.
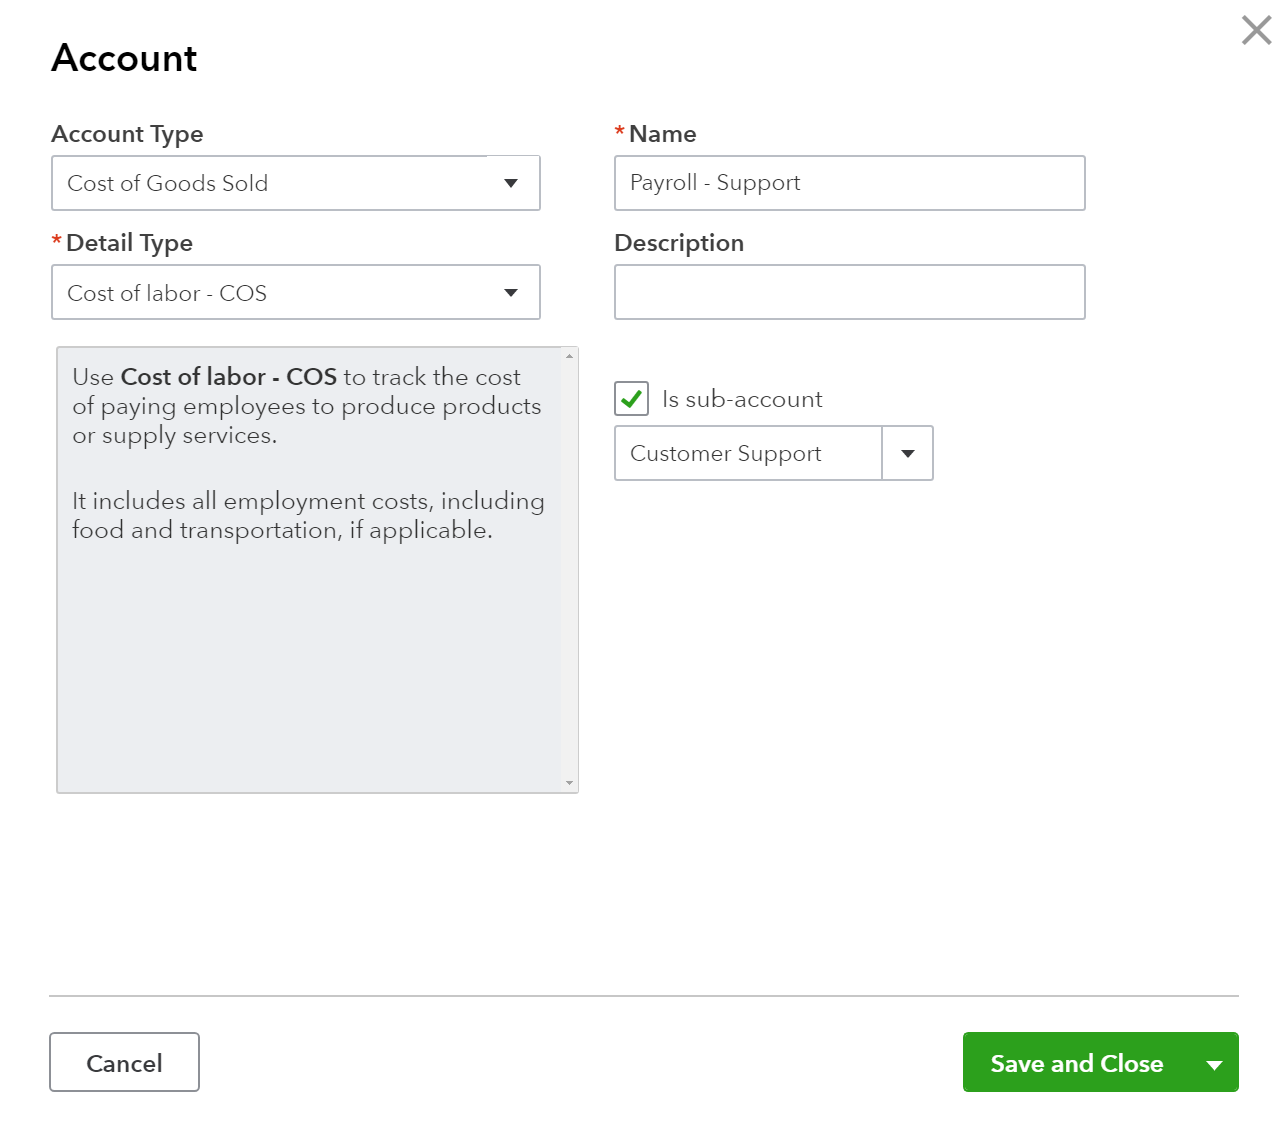
Set the Category Type as Cost of Goods Sold and give a name for the account. Let’s start with Payroll – Support. You’ll also have to select a Detail Type, but I haven’t found this setting to be particularly useful. You could set the Detail Type as Cost of Labor for payroll expenses, and Other for anything else.
As the last step of adding an account, make sure you select the checkbox to mark this account to be a sub-account of the larger category Customer Support, as using account -> subaccount structure will give your books a cleaner look.
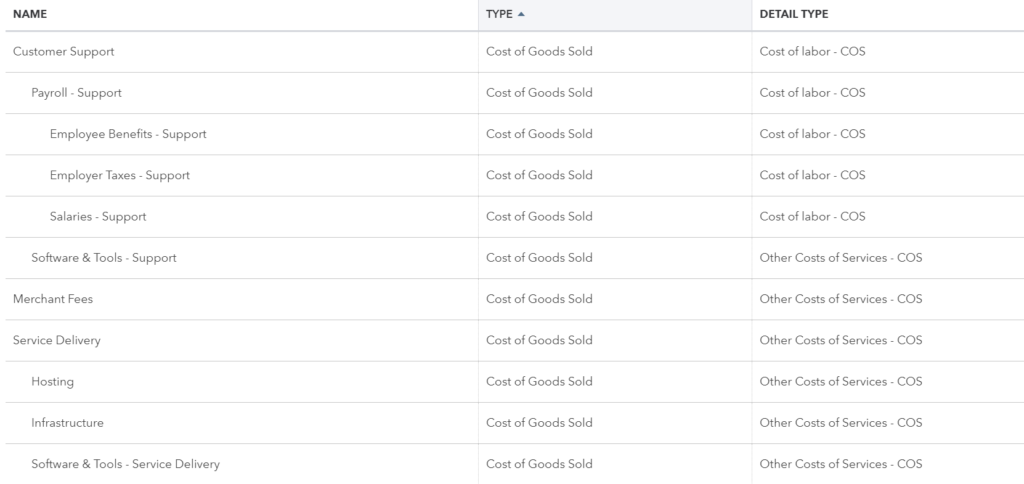
Next, repeat this process for the Wages, Payroll Taxes and Employee Benefits, and make sure they all are subaccounts of Payroll – Support. After that you can add any other Customer Support subaccounts, before moving on to creating another major category such as Merchant Fees.
As a result, you should see something like this in your QuickBooks:
Sales & Marketing
The goal for separating your Sales & Marketing from other expenses is to enable the calculation of CAC, but also to use the S&M spend as a driver to forecast your revenue.
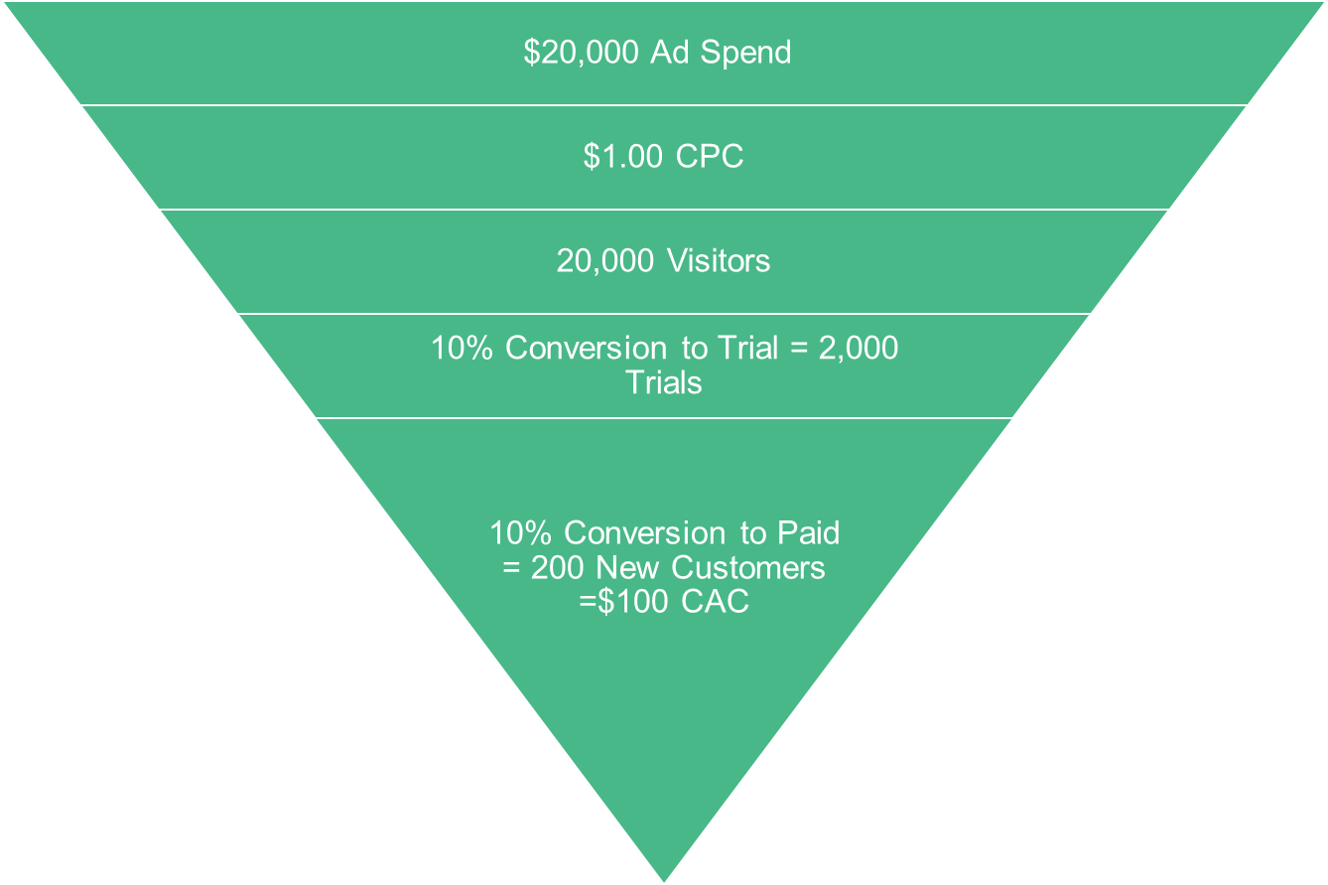
For example, if you know your advertising spend is $20,000 a month and it results in 200 new customers, your CAC is $100. Now, if you also know that your Cost Per Click (CPC) is $1, and conversion to trial averages 10% and further conversion to paid is 10%, you can use the advertising spend as a driver to forecast future revenue.
If spending $20,000 meant 200 new customers, spending $25,000 would result in 250. Although the conversion rates would eventually drop as lower quality leads would come to your site, you could account for that in your forecast. In the end, the goal here is to get a more accurate forecast than putting a finger into the air and declaring 10% month-over-month growth ad infinitum.
To do all this, you need to divide up your Sales & Marketing to Sales, and Marketing sections, respectively. Which are then categorized further using subaccounts.
Sales Expenses – QuickBooks Setup
Here are some typical categories that fall under Sales:
- Payroll
- Software & Tools
- Salesforce, Pipedrive, other CRMs
- Travel – Sales
- Costs related to sales people travelling to see clients
If your sales team is entirely inbound, you probably won’t need a separate sales travel category but can combine it with your General & Admin. Also, if your sales team is fairly large and includes inbound and outbound reps and SDRs, it’s probably worth it to break those out as separate subaccounts under Payroll – Sales.
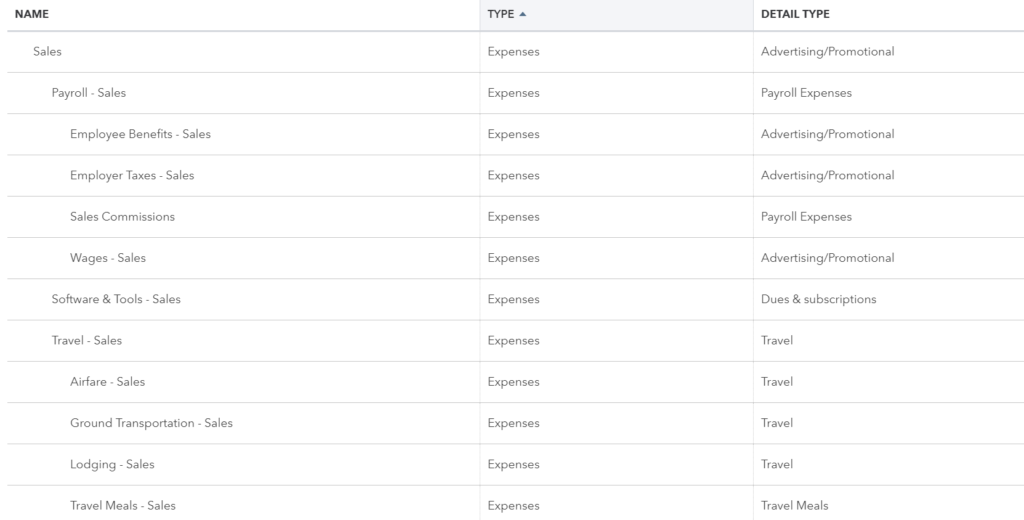
In QuickBooks, start by creating a top-level account called Sales & Marketing with a Category Type Expense. Add Sales as one the subaccounts. Next, add Payroll – Sales as a subaccount of Sales, and add its’ subaccounts of Wages, Payroll Taxes, Benefits and Commissions. Follow the process for the rest of the categories such as Software & Tools – Sales.
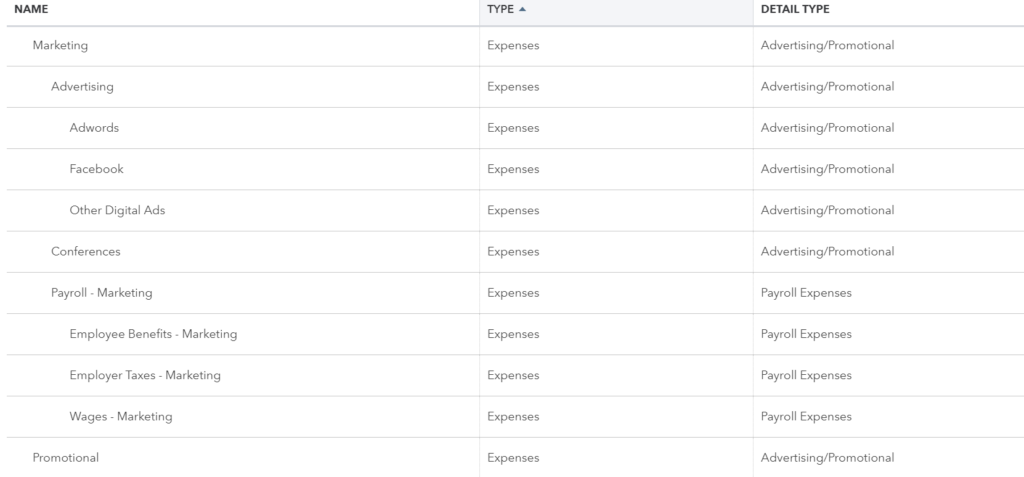
Marketing Expenses – QuickBooks Setup
Here are some typical categories that fall under Marketing:
- Advertising
- Adwords, Facebook, Other Digital Ads
- Conferences
- Payroll
- Promotional
- Swag, business cards, posters
- Software & Tools – Marketing
- Hubspot, Intercom (if used for acquisition), Mailchimp
If traveling to conferences or events is a significant part of your Marketing team’s spend, it might be worth splitting out.
In QuickBooks, add “Marketing” account as a subaccount of Sales & Marketing. As usual, follow by adding Payroll – Marketing as a subaccount of Marketing, and don’t forget the payroll subaccounts. Subaccounts for everyone! Follow the process for the rest of the categories such as Software & Tools – Marketing.
Research & Development (Engineering)
There are fewer direct benefits from splitting out your tech team from the rest of the expenses, but I still recommend doing it.
First of all, you should compare your current engineering spend and compare it against your forecast. A good way to do that is to look at the R&D spend as a % of your revenue. This is a good sanity check to see if you are spending enough in your tech in your forecasts and even enables you to benchmark yourself against other SaaS companies. For example, somewhat lesser-known fact about Zoom’s obviously superior video call tech is the fact that they invest less than half than an average SaaS company to their R&D, given that their Engineering offices are based in a lower-cost countries.
R&D Expenses – QuickBooks Setup
Here are typical categories that fall under R&D:
- Contractors
- Payroll
- Software & Tools
- Github, Jira, even software like Bugsnag that helps you to build a better product
If you have a larger R&D team, I’d split out the Engineering team from the Product and Design teams under in the payroll section.
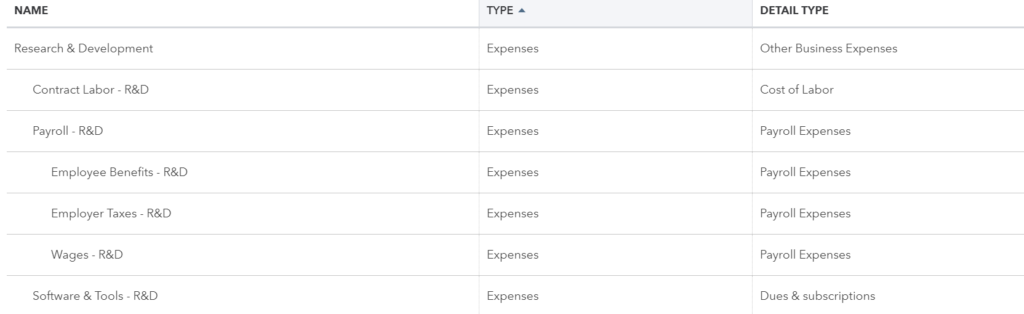
In QuickBooks, start by creating a top-level expense account called Research & Development, and add Payroll – R&D as one the subaccounts. (Don’t forget the payroll’s subaccounts). You’ll probably want to include Contract Labor – R&D for any product-related contractors you work with. Finally, add the software account.
R&D is typically a rather concise section consisting mostly of engineering payroll, so don’t be surprised if you total only a few accounts here.
General & Admin
As far as expenses go, almost everything else can be categorized under General & Admin (or just G&A). This means things like rent or the accountant fees, but also your C-level managers and their assistants.
If you are a smaller team, I recommend not to categorize your CTO or the Sales Leader in G&A until they have at least a few people in their teams. Otherwise it looks like you have a huge overhead and little to no Sales or Engineering expenses, which defeats the purpose of this exercise.
Here are some of the typical categories that fall under General & Admin:
- Insurance
- Meals
- Office Expenses
- Equipment, supplies, postage
- Payroll
- Professional Services
- Accounting, executive coach, legal
- Rent
- Software & Tools
- Hellosign, Chargebee, Slack, etc.
- Travel
- Utilities
G&A Expenses – QuickBooks Setup
In QuickBooks, add “General & Admin” expense account. Now, setting up G&A is a little different from previous sections. Given you’re probably working with a business that already has a Chart of Accounts, you will need to move some of your existing accounts as subaccounts under G&A. Probably most of them.
I usually recommend renaming the existing payroll accounts as the Payroll – G&A, and adding the typical tax & benefit subaccounts if they don’t exist already. While you could create a completely new set of accounts for G&A, there are rarely any benefits of doing so.
Instead of adding a screenshot of a fairly long list of accounts, here’s a SaaS Chart of Accounts template. It won’t have all the accounts you need, but it should give you a solid start that you can then modify to your needs.
Takeaway
These changes should improve the visibility of your past performance but also make your future forecasts more accurate. You’ll get cleaner-looking books that are easier to understand and share with your board or investors.
And remember. SaaS Cost of Revenue = Hosting and Support.
Note: This is not a tax or accounting advice. I’m not a CPA or a lawyer, and you should consult with yours before making any permanent changes to your books.
