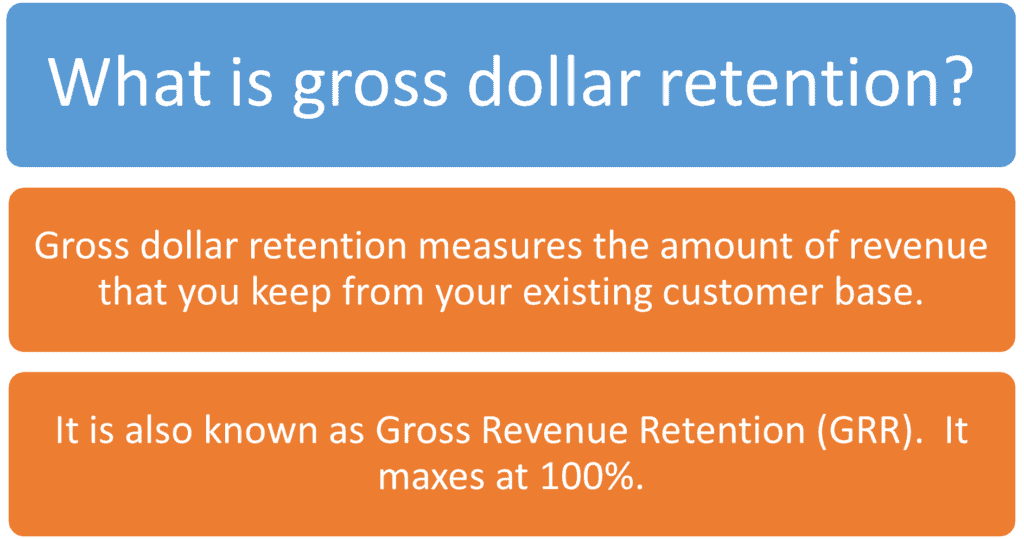
Gross dollar retention measures the amount of revenue that you keep from your existing customer base. Gross dollar retention (GDR) along with net dollar retention (NDR) are critical metrics for SaaS operators and investors.
Gross dollar retention is also known as gross revenue retention (GRR). As operators of our SaaS businesses, it’s critical to track, monitor, and improve the health of our recurring revenue streams. This data also becomes especially important in the due diligence process and valuation discussions.
Gross dollar retention is a “must-have” metric in your monthly reporting package.
In this post, I cover the what, why, and how of gross revenue retention, a critical metric for your SaaS business. Plus, I have a great Excel template download below that will perform the revenue retention calculations for you.
What is Gross Dollar Retention
Gross dollar retention focuses just on the revenue from our existing customer base. We do not include any new and expansion customer dollars in the calculation.
GRR is an important metric to better understand the health of our recurring revenue. We are focused on our existing revenue, contraction revenue, and churn revenue. Thus, the maximum GDR number is 100%.
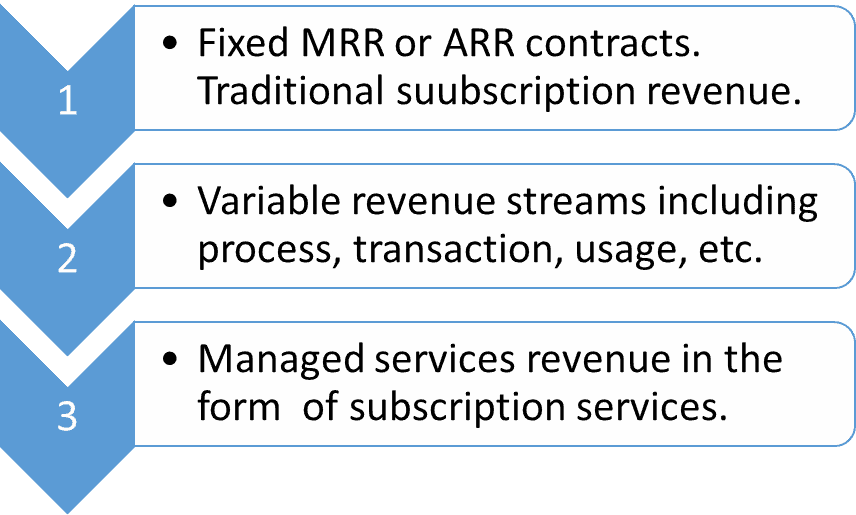
We typically calculate GRR on recurring revenue streams. This includes revenue from subscriptions and variable (usage, consumption, processing, transaction, etc.).
You may sometimes calculate retention on managed services, but one-time revenue is excluded from the calculation.
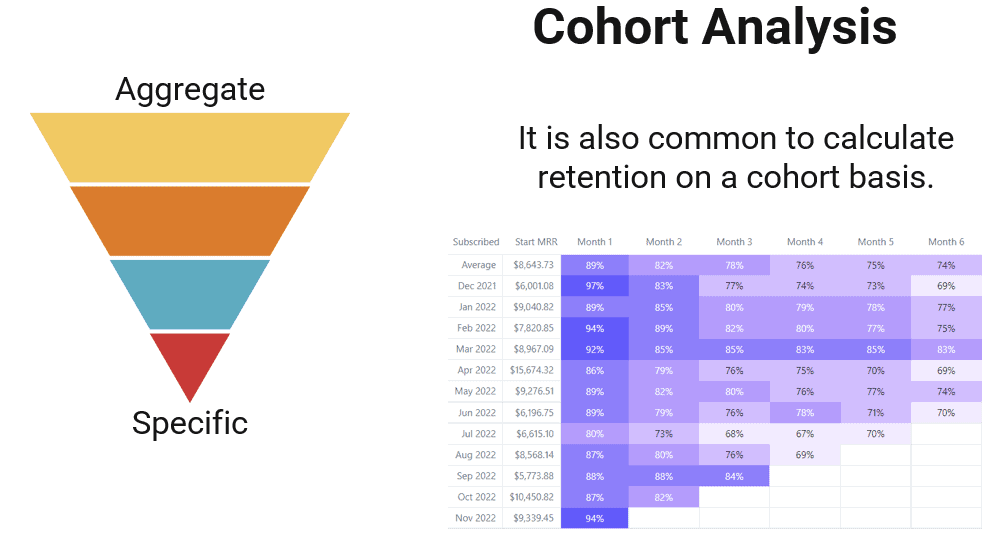
Cohort Retention or Aggregate Revenue Retention
There are two primary methods to calculate GDR. You can calculate retention in aggregate using your total recurring revenue. Or you can calculate on a cohort basis.
Cohort analysis limits retention analysis to a specific group of customers. This is typically measured and grouped by the month of customer acquisition. We then track the performance of that same cohort over time.
SaaS metrics purists argue that cohort retention is the only true retention number. I disagree. If we only acquire one enterprise customer per month, there is not enough data to make cohort retention meaningful.
SaaS metrics purists argue that cohort retention is the only true retention number. I disagree.
The SaaS CFO
We can also also calculate retention on our total recurring revenue. This is aggregate revenue retention. The data is sourced from our MRR schedule. In due diligence, investors and buyers always ask for your MRR schedule so they can perform their on aggregate revenue retention analysis.
I have also calculated GDR on a bookings basis from CRM data. However, this requires opportunity tracking from day one, ideally, of your SaaS company. And it requires strict data integrity with your CRM opportunities. It’s a bit of harder argument to make in due diligence to use bookings data rather than your MRR schedule.
How to Calculate to Gross Dollar Retention (GDR)
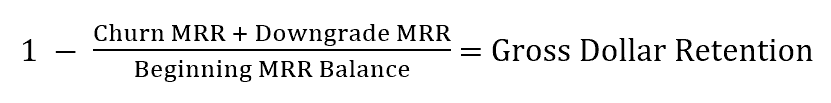
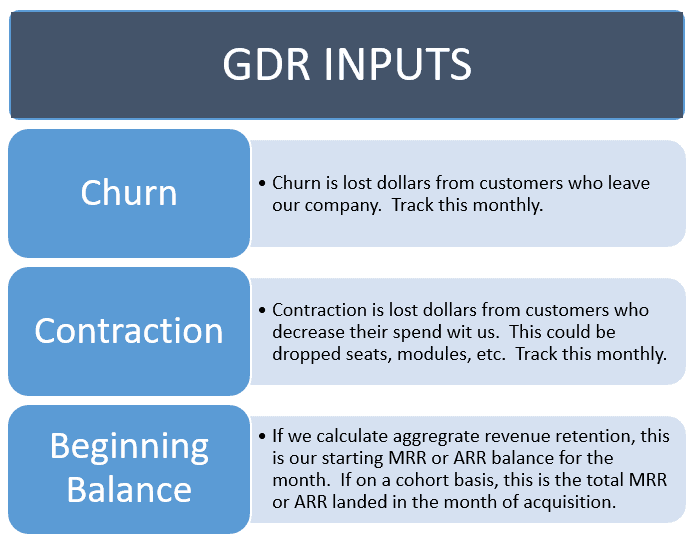
Gross dollar retention measures lost dollars from your existing customer base. Lost dollars mean churn and downgrades or contraction.
Churn is completely lost customers. Downgrades (or contraction) are the net dollars lost when a customer, for example, reduces the number of seats, modules, usage tiers, and so on.
The formula to calculate GDR is below. I use MRR in the formula, but you can replace MRR with ARR if you think in ARR terms.
Gross Dollar Retention Example
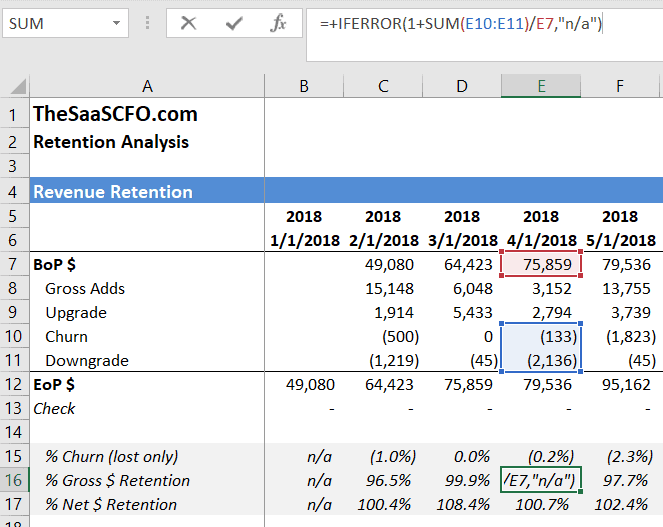
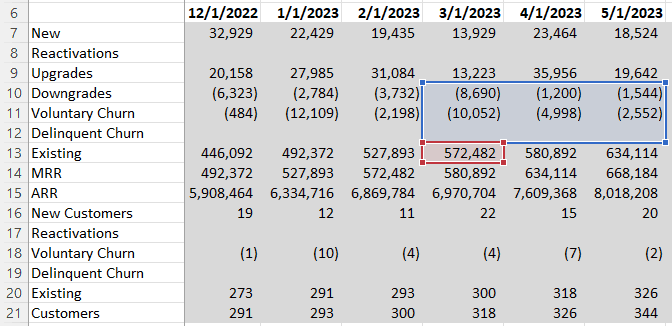
You can see how this formula works in practice in the screenshot below. On a monthly basis, we sum our churn and downgrade dollars and divide that by our beginning MRR balance (BoP $).
In the example below, I am calculating GDR monthly. This is aggregate revenue retention and results in a MONTHLY retention number.
Gross dollar retention maxes at 100%. We cannot have GDR higher than 100%, because we are not taking credit for any expansion dollars. That’s net dollar retention (NDR or NRR).
The graphic below summarizes the gross revenue retention inputs. If you have software that produces your MRR schedule like above, you are in great shape. You have everything that you need to calculate gross revenue retention and net revenue retention.
The Period of Measurement for Gross Revenue Retention
This is where the magic happens. What time period should we measure for GRR? In the spreadsheet example above, I’m calculating GRR using monthly numbers. This results in monthly retention.
I calculate gross revenue retention using time periods that cover one month, three months, and six months. This is done on a trailing basis. See the spreadsheet example below. I’m calculating GRR on a quarterly basis. I will then annualize this retention number.
How to Annualize Gross Revenue Retention
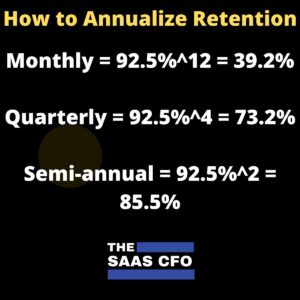
We can’t multiply monthly retention by 12 to get an annual number. Just like we can’t take quarterly retention and multiply by 4. It’s due to the compounding affection of retention.
We must take, for example, our monthly retention number to the power of 12. See the graphic below for example calculations on how to annualize a retention number.
Why Do We Care About Gross Dollar Retention
Recurring revenue is the engine of our SaaS business. We must monitor the health of this engine and adjust the engine if performance declines.
Operators and investors love stable, recurring revenue streams. Valuations are tied to the health of our recurring revenue and your MRR schedule. Great retention provides consistent cash flows and more time to fix other issues in our business.
Poor retention has several downline impacts. It leads to the following financial impacts.
- Lower customer lifetime values because we use churn (1 – GDR) in the denominator of the LTV equation. Poor retention puts more pressure on your new business development team to perform.
- We need more new business bookings to offset the churn deficit and hit our revenue growth targets.
- It puts more pressure on gross margins, increases CAC payback periods, and stresses our P&L.
Revenue retention is also a key due diligence item if you are fundraising or selling your company. High gross dollar retention will support your valuation, so make sure you have this data in order. Typically, three years of retention data is requested.
How to Improve Gross Revenue Retention
In my SaaS Metrics Foundation course, we have great discussions on interpreting the results of retention analysis. We calculated GDR. Now what do we do with it?
In the screenshot below, I highlighted in red several months where GDR appears to trend below historical averages. Students in my course asked, “what do I about this?”
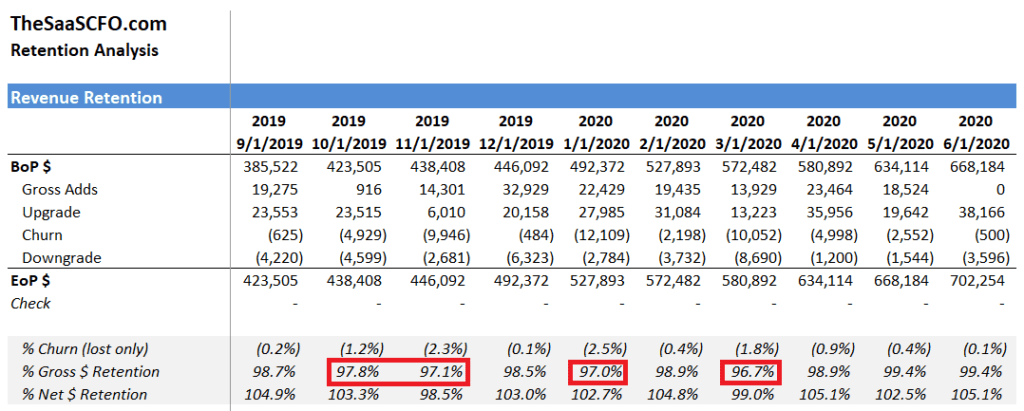
My response…the numbers only tell you half the story. We must dig in operationally with our department executives to understand why. We repeat this process each month. Measure, monitor, and take appropriate action if necessary.
We need to marry the numbers to the operational story to tell the full financial story.
What are the reasons for churn?
• Do we have onboarding issues?
• Do we have technical support issues?
• Do we have product issues?
• Do we have a cohort of customers who were not a good fit for our product?
With this information, I can determine what resources or investments might be required to stabilize and improve retention. I will also adjust my financial forecast accordingly and determine the impact on our margins, cash flow, and related SaaS metrics
Cohort Revenue Retention Analysis
If you have enough data flowing through your business (low price point, high volume SaaS), you can implement cohort analysis and revenue retention.
With cohort analysis, we are looking for “break points” in the data. Do we consistently lose customers at month three or month six, for example?
With this data in hand, we can work with our technical support, customer success, and onboarding team to improve retention. What role do our teams play in the journey of the customer?
What actions are being taken or not taken by our customer? We can analyze this data to get ahead of the churn points and apply additional resources to saving customers.
Gross Dollar Retention Benchmarks
I consider best-in-class gross dollar retention at 95% and above. This assumes we are targeting mid-market and enterprise customers. My rule of thumb is greater than 90% for larger customer contract values and greater than 80% for smaller price point, high volume businesses.
When I benchmark my SaaS clients, I use the latest SaaS metrics benchmarks from Ray Rike, founder of Benchmarkit.AI. I benchmark by company ARR size and by our products average selling price (ASP).
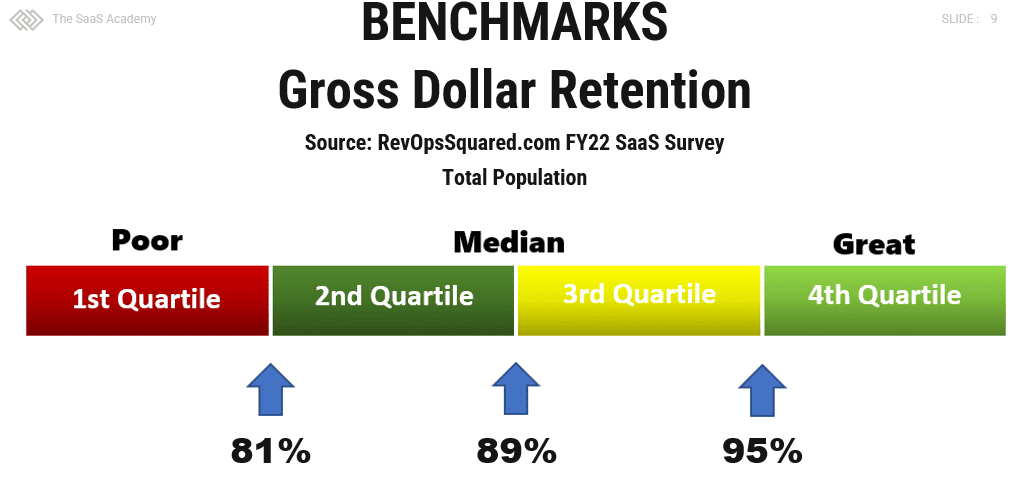
Aggregate benchmarks (not filtered based on your company profile) provide nice, general ranges. However, you should benchmark your business based on your profile (ACV size, etc.). You can benchmark your SaaS business by visiting SaaSKPIBenchmarks.com.
Aggregate benchmarks can be dangerous to your SaaS health.
The SaaS CFO
Which Revenue Streams Apply to Retention Analysis
We can perform revenue retention analysis on several streams. Of course, retention analysis started with our contracted MRR or ARR revenue stream. But what about variable revenue streams?
Variable revenue streams could include usage, processing, transaction, and so on. I’ll perform retention analysis on each variable revenue stream to determine if we have any consistency and predictability.
We want to frame our variable revenue streams as predictable as our fixed MRR/ARR contracts. Then I’ll combine our retention analysis if it tells a better story.
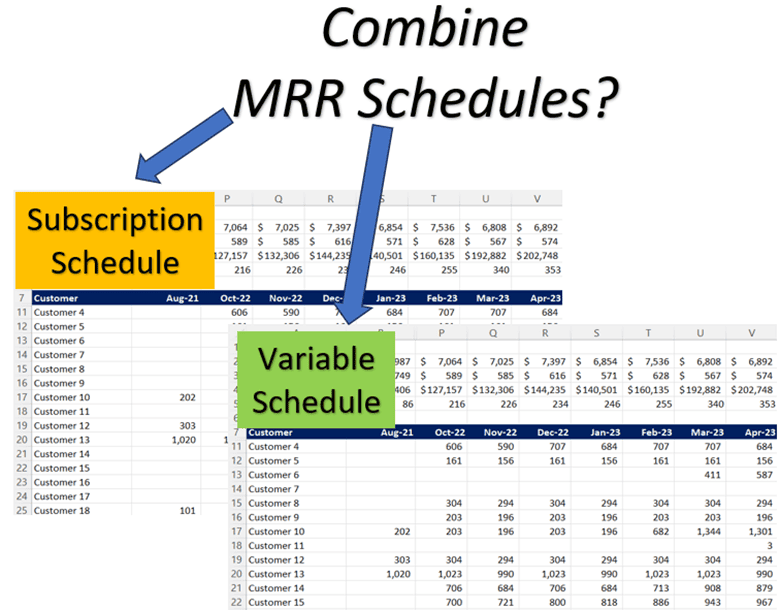
Perform your revenue retention analysis by revenue stream. Then consider combining into one MRR schedule for an overall retention analysis.
Gross Revenue Retention Resources
I have a ton of retention resources to help you. These include video lessons and templates.
- How to Create Your MRR Schedule – video lesson and template
- How to Create Your Revenue Retention Schedule – video lesson and template
Next Steps
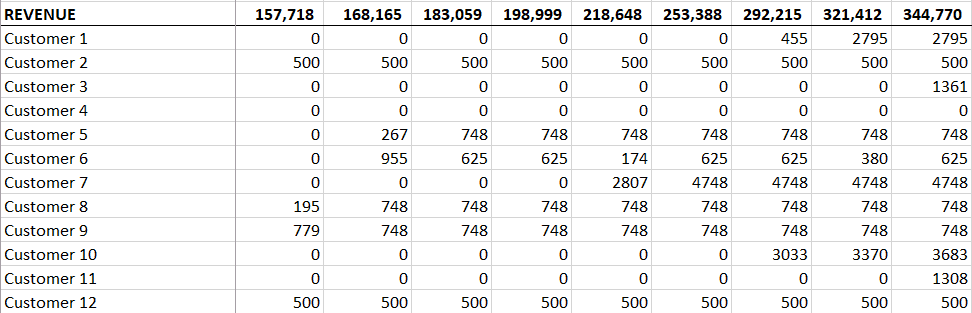
Download my revenue template below and check out my video lessons above. The formulas are like magic! If you can format your recurring revenue data like the screenshot below, you are in great shape. You can then paste your data into my revenue retention template to calculate your GDR, NDR, and logo retention metrics.
I pull this data from invoicing data, payments data, and/or our revenue recognition software. If you invoice in terms longer than a month, invoicing and payments data will not work. There will be gaps in the data which throw off the formulas.
Today, it’s not just subscription revenue anymore. Business models now include usage, consumption, or transaction pricing models to name a few. You can also analyze your other recurring revenue streams with retention analysis.
Download my revenue retention template with the button below. It will save you a ton of time!
I have worked in finance and accounting for 25+ years. I’ve been a SaaS CFO for 8+ years and began my career in the FP&A function. I hold an active Tennessee CPA license and earned my undergraduate degree from the University of Colorado at Boulder and MBA from the University of Iowa. I offer coaching, fractional CFO services, and SaaS finance courses.
Ben – great post!
I sometimes like to differentiate Retention from Renewals. This can help separate business model dynamics from customer satisfaction. Retention is often driven by length of contract – for example, I work with a company with 5+ year contracts. Of course they retain >95%! But when a customer has a decision to make (Renewal), the company may not necessarily achieve that same 95%+
Curious if you track renewal rates vs. retention to help understand the data better?
Hi Jon, thanks for the comment. Yes! I do track Renewal Rate separate from retention. Especially important with multi-year contracts. Ben.