Microsoft Power BI and Tableau are two of the most popular and robust business intelligence tools on the market today. Both are great for making data-driven decisions.
Tableau is best for managing complex data at scale and turning large datasets into actionable visualizations. It has the edge over Power BI in terms of its features and capabilities, but Tableau is definitely designed for advanced users and data analysts that know their way around BI software. Power BI is better suited for general business users that need a way to make sense of their data.
Microsoft Power BI Compared to Tableau
Microsoft Power BI accommodates the needs of individuals, midsize companies, and enterprise organizations alike. Compared to Tableau and other BI tools on the market, it’s a bit more user-friendly for beginners and people who don’t have a ton of experience using data visualization software and building reports. Sign up to start for free.
Tableau is built for data analysts that need to simplify complex data into powerful visualizations. Compared to other BI software on the market, Tableau is truly in a league of its own for advanced data visualizations. You can take massive datasets from multiple sources and make sense of everything through a seemingly limitless number of visual dashboards for storytelling, sharing, and advanced analytics. Start a 14-day free trial.
More Top Business Intelligence Software
Power BI and Tableau aren’t the only market leaders in the BI software industry. We spent more than 80+ hours researching, testing, and reviewing the best business intelligence software for different use cases. See all of our top picks to learn more about the category as a whole and consider some alternatives before finalizing your decision.
Where Microsoft Power BI Shines

Hundreds of Data Visuals: Power BI makes it easy to turn your data into simple visuals that can be used for a wide range of different use cases. These data visualizations are great for making quicker data-driven decisions, as well as sharing insights with key team members and stakeholders. Between the Power BI library and AppSource, there are hundreds of different visualization options that can integrate seamlessly with Power BI.
Build Custom Visuals: If you can’t find the exact visuals you’re looking for in the library, Power BI makes it easy to create them on your own. You can customize specific data visualization requirements based on your industry and organizational needs. This gives you the power to design and implement custom and proprietary data visualizations for your organization.
User-Friendly Interface: Many BI tools and data visualization solutions on the market have a reputation for being rigid and complicated. But Microsoft Power BI is surprisingly easy to use, making it an excellent option for general business users who lack the technical expertise required for advanced tools. You still need to have some basic tech skills to use Power BI, and there’s a gradual learning curve. But overall, the platform is simple to use, and you don’t need to be a data scientist to figure it out.
Drag-and-Drop Capabilities: Once you connect your data with Power BI, making the most of your data is easy. It’s just a matter of dragging and dropping files or checking boxes to build dashboards and reports. You can click an empty space on your dashboard, drag a data source, and create a graph, table, or other visual in a matter of seconds. Everything is at your fingertips and very obvious when you’re moving things around on the screen.
Affordable Pricing: Microsoft Power BI has one of the lowest entry-level price points on the market in this category. Starting at just $9.99 per user per month, it’s tough to find a better deal. Even the Premium version of this software is just $20 per user per month, which is less than one-third of the price compared to Tableau.
Cloud and Local Deployments: You can use the Power BI service, Power BI desktop, or both for your business intelligence needs. Installing the desktop version on your local device makes it easy to connect with different data sources and transform that information into multiple models. Many users like the desktop version for creating reports and use the cloud-based service for distribution, sharing, and team collaboration.
Where Microsoft Power BI Falls Short
Sharing Limitations: Power BI makes it easy to share dashboards internally with organizational members or publish them publicly on the web. However, it’s difficult to share dashboards with users outside of your organization through a login. There are definitely some workarounds to this, but none that are offered directly through Power BI’s platform.
Rigid Integrations: This shortcoming echoes many of Microsoft’s products. If you’re planning to use Power BI with non-Microsoft applications and third-party tools, the process just isn’t always smooth. Power BI works best if you’re pulling data from apps within the Microsoft ecosystem. You can still get data from other sources and integrate third-party tools, but the process can be a bit frustrating.
Lack of Premium Support: Power BI Pro customers and above get support included in their plans at no additional cost. But this is handled through ticket support, which isn’t always ideal when you’re managing data, creating dashboards, and need some white-glove assistance. Microsoft does have a paid enterprise plan for premier support, but it’s more of a general Microsoft support option that’s not specific to Power BI.
Where Tableau Shines

Outstanding Visualization Capabilities: Tableau offers unparalleled data visualization options when compared side-by-side with Power BI and every other business intelligence software on the market. The quality of the data visualization and possibilities is far superior to all of its competitors. You can use Tableau to convert unstructured statistics into logical data and put that information into functional and interactive dashboards.
Engaged Community and Resources: There are more than one million community members and over 110,000 partners in the Tableau community. So you can connect with other analysts in your industry, share insights, and get the most out of your subscription. You’ll also have access to nearly 500 training videos and over 1,300+ learning resources to sharpen your skills.
Variety of User Types: While Tableau is expensive, you have the ability to control some of these costs by assigning different user roles during deployment. There are three main roles—creator, explorer, and viewer. Creators have access to everything, whereas viewers can only see and interact with dashboards. Explorers fall somewhere in the middle, which ultimately gives you more flexibility for how your team uses Tableau.
Multiple Deployment Options: Most organizations tend to go with a Tableau cloud plan. This is a full-hosted solution that offers the simplest deployment. You can also deploy Tableau as an on-premises solution or through a public cloud, and the per-user rates remain the same for all deployments. However, on-premises and public cloud plans do require a Tableau Server license that will likely cost at least $20,000 per year.
High Performance: Even when you look past the amazing visualizations and powerful capabilities, you’ll quickly find that Tableau is a well-oiled machine. Users rave about its powerful performance, speed, and reliability. This is crucial, especially if you’re using Tableau to manipulate massive quantities of big data. It’s great to know that the software continues to run at peak performance, even if you think you’re pushing the tool to its limits.
Wide Range of Data Sources: You can connect Tableau to nearly any type of data source imaginable. In simple terms, you can connect it with both files and servers. But when you look beyond the surface level, you’ll see that Tableau supports everything from Excel files and PDFs to JSON, local text files, Microsoft SQL servers, MySQL servers, and more.
Where Tableau Falls Short
High Prices: Starting at $70 per user per month, Tableau is expensive. This looks even higher when you’re comparing it with Power BI, which starts at $9.99 per user per month. Even the Power BI premium plan is less than one-third the cost of Tableau. While the package is expensive compared to other BI tools on the market, you’re definitely getting one of the highest quality solutions available.
Steep Learning Curve: Tableau is not made for beginners. To use this software effectively, you need to have some experience using other tools for business analytics and data visualization. The software isn’t designed for the average Joe with internet access or even tech-savvy business users. Data analysts, data scientists, and data engineers will have an easier time getting the most out of Tableau.
Lack of Post-Sales Support: Tableau’s sales staff tends to win you over if you’re asking questions and need some assistance getting started with the software. But once you’ve deployed, there’s a noticeable lack of support when you encounter roadblocks. Many Tableau reviews from real users point to this shortcoming, as they’re frustrated with the process of troubleshooting and getting problems solved without premium support.
The Final Verdict on Microsoft Power BI Compared to Tableau
In terms of pricing, Microsoft Power BI is significantly more affordable compared to Tableau. Let’s take a closer look at the plans and rates so you can see the differences.
Power BI Pro starts at $9.99 per user per month, and it’s included in all Microsoft 365 E5 subscriptions.

For companies already using a Microsoft ecosystem, having Power BI Pro included with your enterprise deployment of 365 makes sense. Otherwise, getting Power BI Pro on its own without the full suite of apps is still fine for business intelligence.
This plan is ideal for users with basic needs and lower storage limits. For advanced AI, direct query dataflows, enhanced computing, application lifecycle management, and 100 TB of storage, the Power BI Premium plan for $20 per user per month is an excellent value.

The Premium plan also refreshes the data 48 times per day, compared to just eight times per day for Pro users.
For Premium licenses charged per capacity, starting at $4,995 per month, you can share reports and contents with users on a free license. That said, organizations with a $5,000 monthly budget on BI software can get more value from other tools.
Tableau’s pricing starts at $70 per user per month, which is definitely on the higher end of the spectrum compared to Power BI and other tools in this category. That said, you get what you pay for, as Tableau leaves you wanting for nothing.

At first glance at the pricing table, it looks as though Tableau starts at just $15 or $42 per user. However, every deployment requires at least one Creator license.
Fortunately, you can manage your costs based on user roles. You’re not forced to pay the full $70 per license for certain people who only need to view and interact with your dashboards.
Here’s a quick glance at some of the capabilities at each user level:
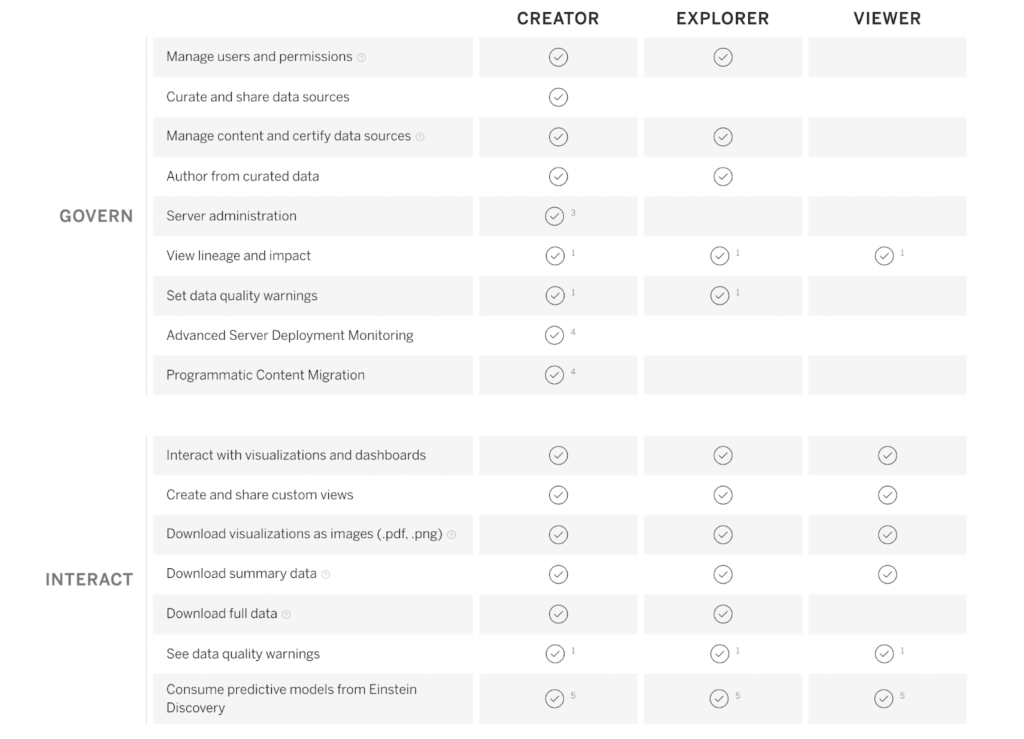
In short, the Creator license has it all. The Explorer license allows those users to do more than just view data. But they can’t create new data sources, publish data, share data sources, or manage server deployments.
The vast majority of organizations will have a mix of all roles when deploying and scaling Tableau.
Overall, Tableau has the edge over Power BI in terms of its features and capabilities. It’s the best BI tool on the market data for data analysts and complex data visualizations. While Power BI didn’t make our top picks, there are still plenty of use cases for organizations with basic data analytics needs.
Microsoft Power BI and Tableau are just two options to consider. We have an in-depth review of the best business intelligence software that includes a buying guide on how to find the best solution for your unique needs. Make sure to read our full review before you choose.
- Zoho Analytics – Best for most
- Dundas – Best for flexibility and customization
- Tableau – Best for complex data visualization
- Sisense – Best for developers
- Board – Best for corporate performance management
- Clear Analytics – Best basic business intelligence software
- GoodData – Best BI tool for embedding analytics
- Yellowfin BI – Best full business intelligence product suite

