Application Analytics Guide For Product Managers
What is application analytics? How can they help product teams extract actionable insights and build product experiences that deliver more value and delight to customers?
If you’re after the answers to these two questions, we’ve got you covered.
Let’s get right to it.
TL;DR
- Application analytics is the process of collecting and analyzing product usage data to inform product development.
- Web analytics focus on page views (outside the product), while application analytics concentrates on in-app events.
- Application metrics are quantifiable measures of product performance. Application analytics uses metrics to make conclusions.
- Performance analytics deals with the technical performance of the product, like its speed or reliability. Usage analytics is interested in how easy the product is to use and how well it satisfies user needs.
- Tracking user behavior enables you to identify successful user behaviors and promote them for other user segments.
- Tracking product usage at all customer journey touchpoints is necessary to develop fully-satisfying user experiences.
- With feature tracking, it’s possible to identify the most valuable features, those that need further improvements, and those that you may need to sunset.
- Heatmaps are great for application UI optimization because they show you what exactly users do in the app.
- User journey tracking enables teams to remove friction from the points where users drop off.
- Cohort analysis gives you insights into the impact of product changes on user retention and how it varies across seasons.
- Mixpanel is one of the best mobile analytics tools. It offers a vast array of analytics features and reports that allow both high-level and granular product usage tracking.
- Userpilot is a product adoption tool with very ample analytics functionality. If you want to see how you can use it to analyze your web app usage and act on the insights, book the demo!
What is application analytics?
Application analytics involves recording and analyzing application usage.
Application analytics allows product managers to gain insights into user behavior to improve their experience at different stages of their journey.
How is app analytics different from web analytics?
Application analytics and web analytics track different processes.
Overall, web analytics is concerned with page views. They track data like how many users access the page, how long they stay there, where they come from, or what device or OS they use. That’s what tools like Google Analytics are for.
Apps analytics mostly deals with user behavior inside the product. The focus is on actions like swiping, clicking, or hovering, which we call ‘events.’ To track such behavior, you need a different tool stack.
Application analytics vs application metrics
Application metrics are quantifiable measures that you can use to track and evaluate the performance of your product. These could include conversion rates, active users, or NPS scores. Metrics are the starting point in the data analysis.
Application analytics is the process of collecting data and analyzing it to be able to make better product decisions. It uses metrics and applies different techniques, like statistical analysis or predictive modeling, to extract actionable insights, often with the help of analytics tools.
Different types of application analytics
There are two main kinds of application analytics that your team is likely to be interested in: performance analytics and usage analytics.
Application performance analytics
Application performance analytics is concerned with the tech side of the application. Its interest is in the reliability and speed of the app. Key metrics in this category include:
- Uptime
- Crashes
- Exceptions
- Technical errors
- Data transactions
- Carrier latency
- API latency
Performance analytics are the domain of the development team rather than the product team.
Application usage analytics
Application usage analytics involves tracking and analyzing user behavior inside the product. It focuses on how many users engage with different application features, how regularly they engage, and how they progress through the funnel. Common usage metrics include:
- Product onboarding engagement rate
- Activation rate
- Product adoption
- Time to value
- Number of key user actions per session
- Customer Engagement Score (CES)
- Feature usage
- Product stickiness
These are the kinds of data that product managers need to improve their products and add value. And that’s what we’re focusing on in this article.
How to use application analytics for real-time analysis?
With the right tools, it’s possible to track every single cursor move or swipe inside the product. How do you take advantage of such an abundance of data to make better product decisions?
Analyze user behavior patterns
App analytics can help you identify patterns in user behavior that lead to either their success or failure.
For example, you could segment your churned users and look at common themes in how they engage with the app.
Or, you can analyze how power users interact with the app to identify their happy paths. With that knowledge, you can design user onboarding experiences that will make other users with similar JTBDs emulate them.

Track product usage across important customer journey stages
When tracking product usage, make sure to do it across all touchpoints in the customer journey. In this way, you will be able to reflect on and improve user experience thoroughly.
For example, at the acquisition stage, you could be looking at sign-up flow completion or engagement with demo content. At the activation stage, you could be interested in how users interact with the onboarding flows.
Which data points exactly you look at depends on the user segment or user persona, so start by mapping out your journey for each of them individually.

Identify popular features through feature tagging
Feature tagging enables you to track user engagement with different UI elements. By recording every user click, hover, or text input, you can find out which features deliver the most value to users, and which are underutilized.
Again, it’s best to use it in conjunction with segmentation, so your analytics software should give you the option to filter the results. In this way, you can see which users engage with the features that are relevant to their use cases, and which are not.
In the case of the latter group, you can use in-app guidance to help them discover the feature, help them experience more value, and potentially prevent them from churning.
Feature usage data also tells you which features you should prioritize for future development, and which of them to sunset.

Monitor areas of high and low engagement with heatmaps
Heatmaps give you an even more granular picture of what users do inside the product, and more importantly, what they don’t.
When combined with session recordings, they can help you understand which parts of your UI are the best for displaying key information or features, and where users experience friction.
These could be all those unclickable UI elements that users are trying to engage with or crucial features they don’t notice.

Understand where users drop off by tracking their user journey
Before you invest your time in heatmap and session recording analysis, goal tracking and funnel analysis can help you identify the path your users take.
If your users fail to advance from one stage of the journey to another, it’s a clear signal they’re facing an issue at this point that requires further investigation.
Apart from heatmaps, you could use some more old-school techniques like interviews or surveys that will help you get to the root cause of the problem.

Measure user retention through cohort analysis
Retention analysis enables you to determine whether or not customers stay with your business and keep engaging with the product regularly. This tells you how valuable the product is for your users.
Retention analysis is best done by cohorts, that is user groups that have signed up or subscribed to your product within a specific period of time.
In this way, you can pick up fluctuations resulting from seasonal factors. For example, if you have a fitness app, you may see an increase in sign-ups in January, but the retention in this cohort may be worse than in those that join at different stages in the year.
Such data is also useful for assessing the impact of product updates, changes to customer support, or different marketing efforts over a period of time.

The best app analytics tools for SaaS companies
Product managers are spoilt for choice when it comes to in-app product analytics tools.
Finding the most suitable tool isn’t easy though. The product descriptions on their websites aren’t always detailed enough and reviews give you only a partial view. Even product professionals rarely have enough experience using various tools to be able to provide a breakdown of their key differences.
With that in mind, let’s look at a couple of tools that we believe tick most of the boxes.
Userpilot for web applications
Userpilot is a digital product adoption platform.
Its customers are medium-sized SaaS companies in pursuit of product-led growth. Userpilot helps them by providing tools to collect user feedback, collect and analyze product usage data, and drive engagement with in-app experiences.

For a product that is not a dedicated app analytics tool, Userpilot supports a fairly comprehensive suite of analytics features:
- Advanced user segmentation functionality
- Goal tracking for user journey analysis
- Custom events
- Product feature tagging and analytics
- Heatmap visualization
- Integrated NPS score analytics, including qualitative response tagging
- Quantitative survey analytics
- Checklist and resource center analytics
- Real-time data analysis
- A/B experiments for its in-app experiences
Userpilot doesn’t support mobile app analytics for now but it’s definitely worth considering as a web app analytics platform.

Userpilot pricing
Userpilot’s transparent pricing ranges from $249/month on the entry-level end to an Enterprise tier for larger companies.
Furthermore, Userpilot’s entry-level plan includes access to all UI patterns and should include everything that most mid-market SaaS businesses need to get started.
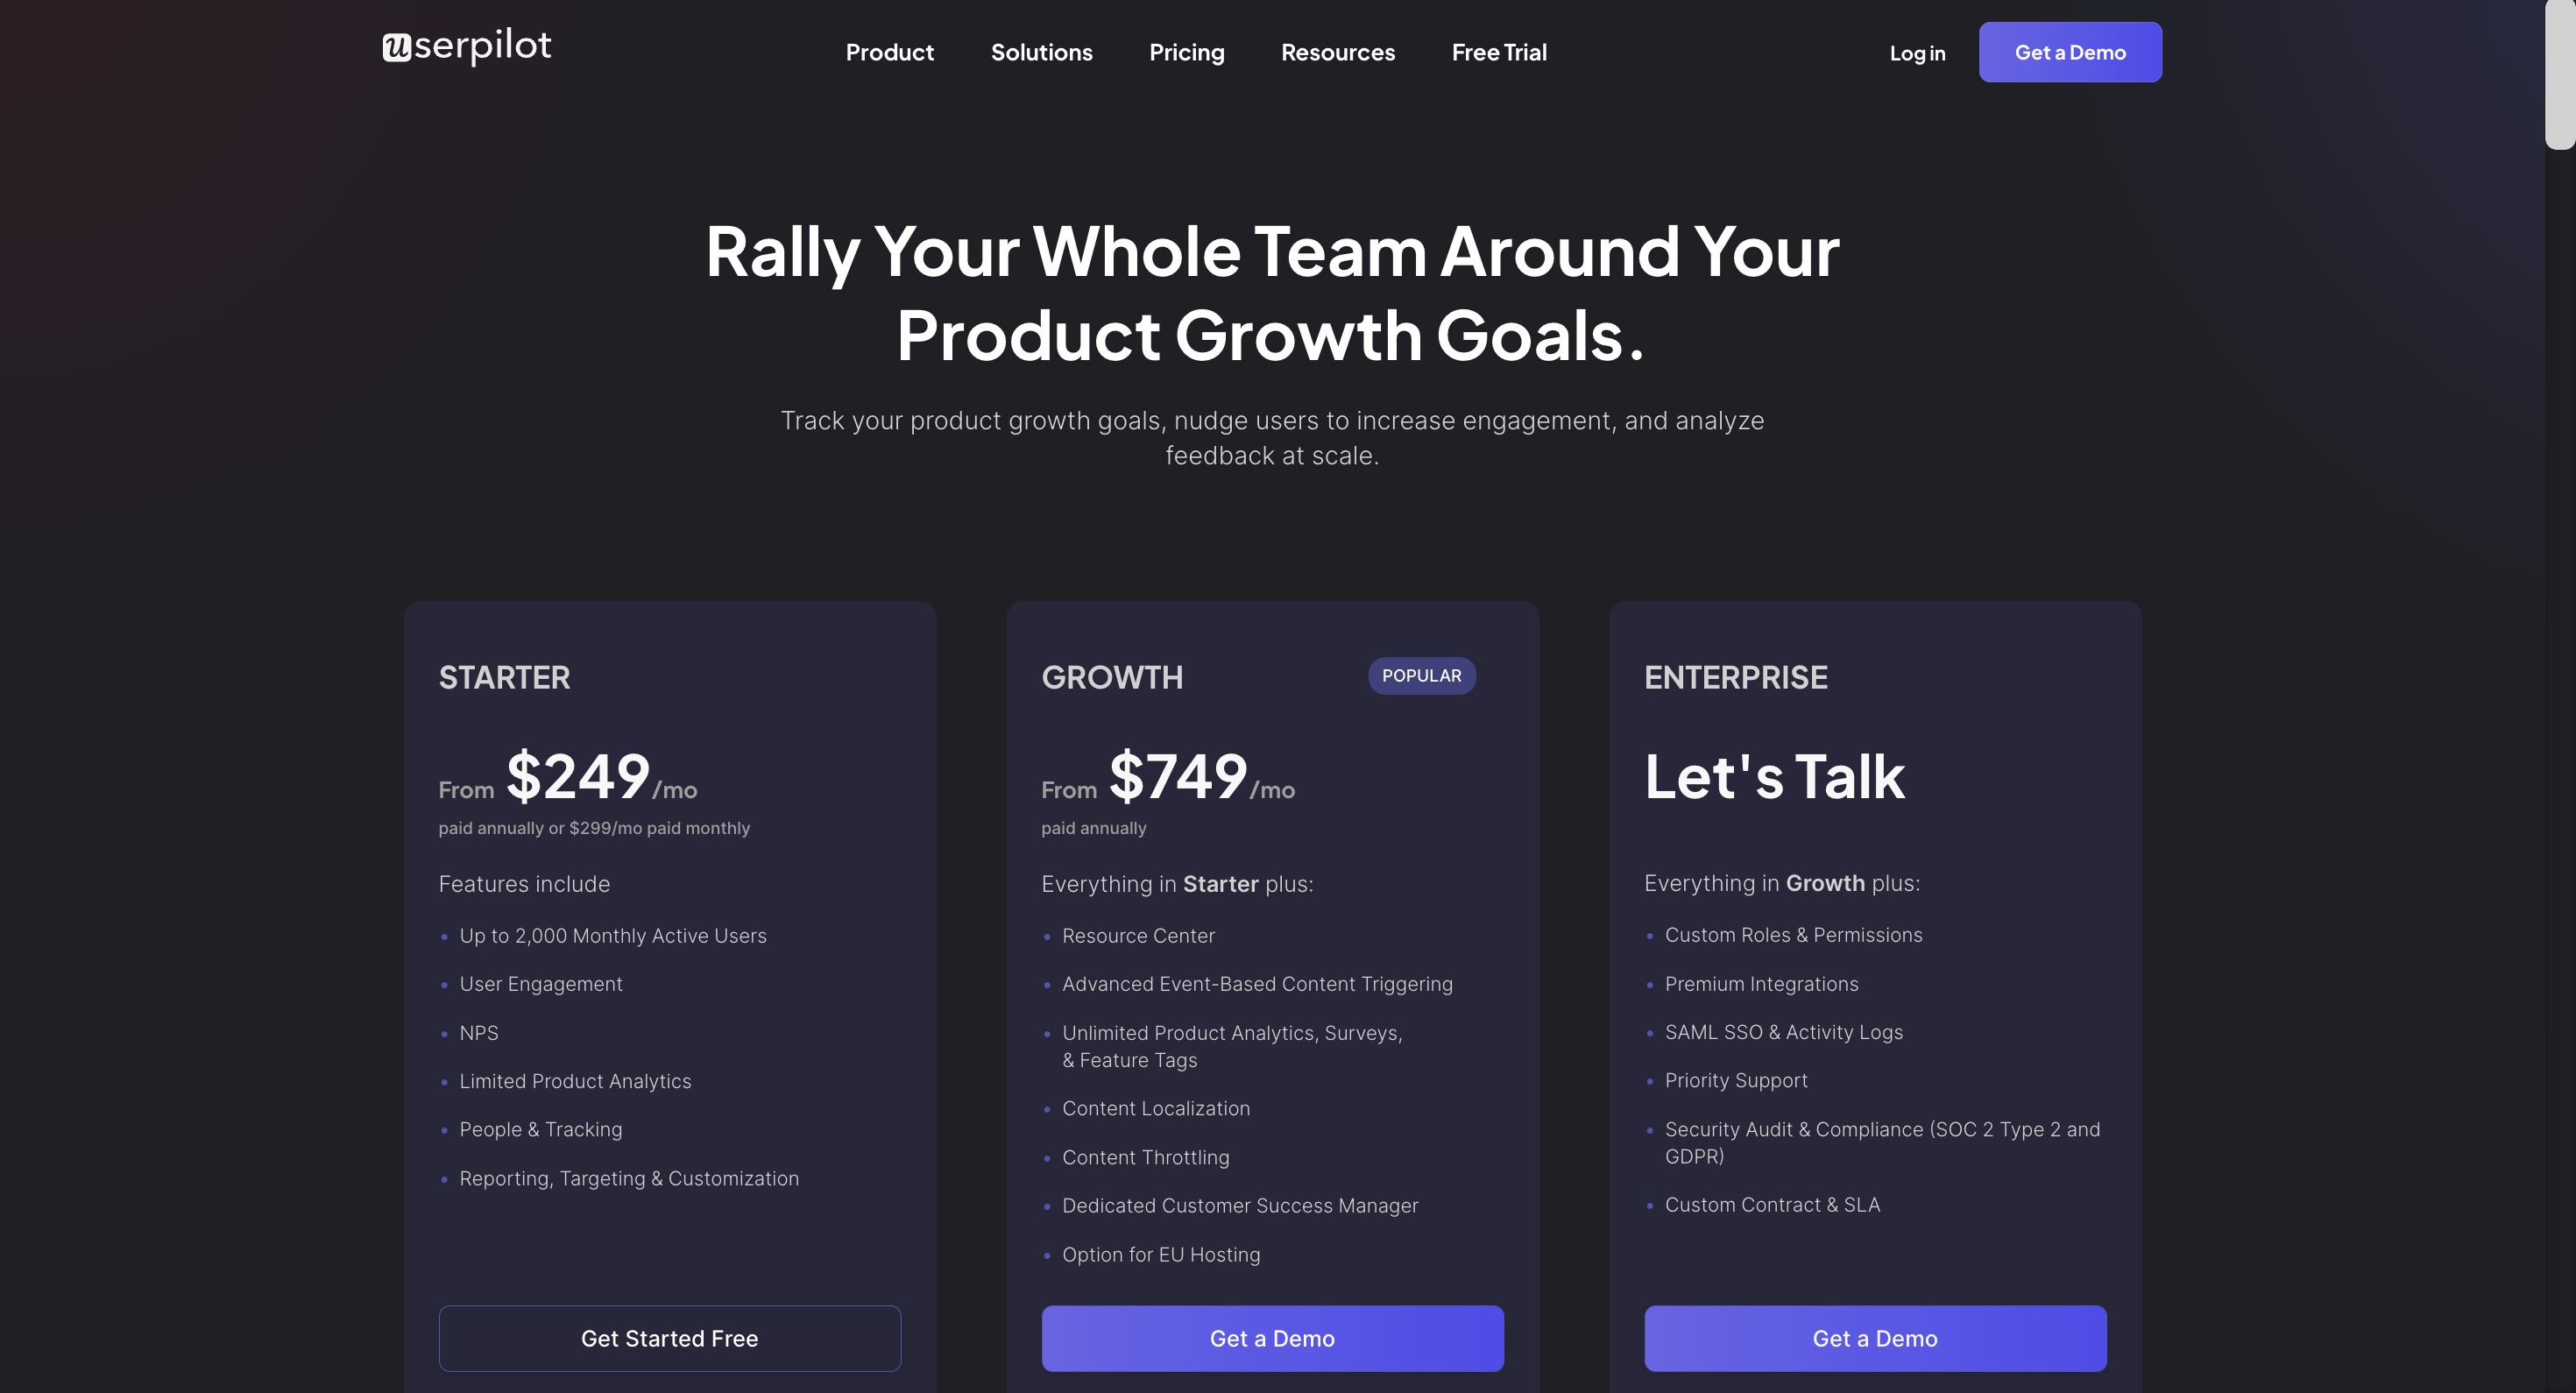
Userpilot has three paid plans to choose from:
- Starter: The entry-level Starter plan starts at $249/month and includes features like segmentation, product analytics, reporting, user engagement, NPS feedback, and customization.
- Growth: The Growth plan starts at $749/month and includes features like resource centers, advanced event-based triggers, unlimited feature tagging, AI-powered content localization, EU hosting options, and a dedicated customer success manager.
- Enterprise: The Enterprise plan uses custom pricing and includes all the features from Starter + Growth plus custom roles/permissions, access to premium integrations, priority support, custom contract, SLA, SAML SSO, activity logs, security audit, and compliance (SOC 2/GDPR).
Mixpanel for mobile applications
Mixpanel is a powerful product analytics solution that helps SaaS companies track and drive user engagement in-app, both for web and mobile apps.
As you’d expect from an analytics tool of this caliber, Mixpanel delivers comprehensive product analytics functionality:
- Flows analytics – to track user paths and drop-off points
- Impact analysis – to determine the impact of new features
- Query-time data modeling, including custom events
- Custom dashboards
- Life events (real-time data access)
- User segmentation & cohort analysis
- Funnel analysis
- Retention analysis
- A/B testing
Mixpanel supports both iOS and Android platforms, and we recommend it for mobile application analytics.

Mixpanel pricing
The product comes with a very generous free plan:
Free
- Up to 20M events/month
- All core reports for user journey analysis (Insights, Flows, Funnels, Retention, Cohorts)
- Query-time data modeling (statistical operators, behavioral frequency analysis, custom session, custom events, custom properties)
- Live Events
- Custom dashboards
- Metrics in minutes with templates
- Unlimited collaborators
- Unlimited integrations
- US or EU data residency
- GDPR, CCPA, and SOC2 type II compliance
- Mixpanel Community and Email Support
The key reason to upgrade for most companies will be reaching the 20M event cap. If you get there, you have two more plans to choose from:
Growth
- Custom pricing, from $20/month
- Up to 300M events/month
- All features included in Free
- Unlimited saved reports to monitor, update and iterate on KPIs
- Unlimited saved cohorts for deeper behavioral analysis
- Mixpanel Modeling Layer
- Mixpanel Community and Email Support
- Group Analytics & Data Pipelines add-ons
Enterprise
- Custom pricing, from $1,667/month
- 5M-1B+ events/month
- Everything in Growth
- Granular access and privacy controls
- Data views for team-based collaboration
- Onboard users with automated provisioning & SSO
- Personalized customer success to improve data fluency across all teams
- Priority support SLAs

Conclusion
Application analytics enables product managers to analyze user behavior data and extract actionable insights that they can leverage to develop better products.
Modern product data analytics tools enable you to collect various kinds of product usage data, like feature engagement or progress through the funnel.
When choosing product analytics software for your tool stack, the key decision is whether to go for a specialist analytics platform, like Mixpanel, or a product adoption platform, like Userpilot.
If you want to see if Userpilot’s analytics features make it a good match for your product, book the demo!

