I get this question a lot:
“How do I measure content marketing success?”
I like this question because I can give a concrete answer. It’s a much better question than, “when will my content marketing work?” or “what are some good content marketing examples?”
So often, people working in content marketing think that performance is subjective.
It’s not.
There are very real, specific metrics that show you how well your content is performing.
But be careful. There are also vanity metrics out there that can be more distracting than worthwhile.
That’s why in this content marketing guide, I’m going to give you the most valuable content marketing metrics for evaluating the performance of your content. By the end, you’ll know exactly how to measure content success.
The 13 Most Important Metrics to Track Your Content’s Performance
Metric 1. Traffic
No surprise here.
If you’re a regular reader of my blog, you know that I’m all about traffic.
Traffic is the most important metric because it enables everything that comes after it: engagement and conversion.
But traffic by itself is not a clear indicator of your content’s performance.
The real metric that you should be paying attention to is the increase in traffic over time.
Every site or blog will have different levels of traffic.
Some are better at SEO than others. Some have been around longer. Others have bigger marketing budgets that can boost traffic numbers.
You should read my post about creating an organic traffic pipeline to get up to speed on the basics of traffic acquisition.
There is no definite amount of traffic that you should have. Each blog and website will have different objectives and a different threshold of traffic before people start to convert.
All websites do share a common goal, however, and that is to increase traffic.
If you’re properly executing your content strategy, you should see an increase in traffic over time. That change in traffic is a clear indicator of performance. That’s why it’s important to keep a record.
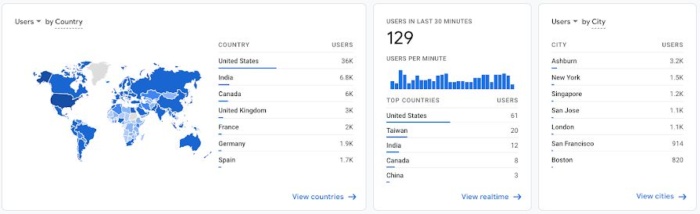
In Google Analytics, traffic is divided into two different categories: users and sessions.
Users are the unique visitors. Unique visitors only count someone once during a timeframe. For example, people who visit my blog every day would only be counted once when I add up the users for the month.
Sessions count each time someone comes to your website regardless of if it’s their first time or not.
So, if you come to read my blog once a week, that would add up to 4 sessions per month.
Both measures have value for different types of reasons. What we are really concerned with is the change in traffic over time.
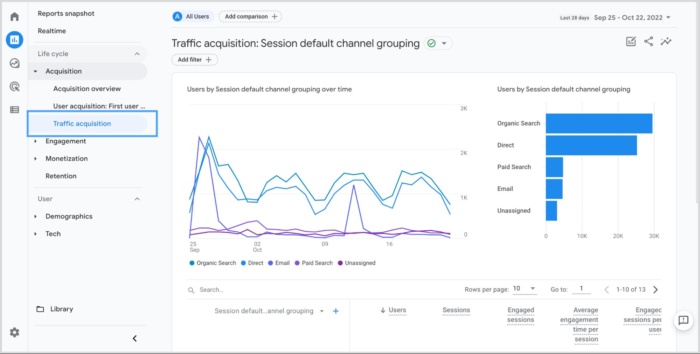
The quickest way to see this in GA4 is in the traffic acquisition report, which you can find under Life cycle > Acquisition.
Keep your record every month and see how it changes.
Line that up with the content that you posted.
Then, isolate months where things went really well and look to see what you did.
When something works, you should do more of it.
You can learn the best practices and start to adopt them as you progress, while at the same time cutting out things that you did that didn’t make your traffic increase.
Metric 2. Traffic Sources
Understanding how many people are visiting your site is important, but it is also important to understand where that traffic comes from.
There are three primary sources of traffic.
- Direct visitors: These are visitors that come to your site by directly typing your URL in their browser address bar.
- Search visitors: These site visitors find you through a search engine, usually Google.
- Referral visitors: These visitors click through a link to your site from somewhere else, whether that’s another website, a social media page, or somewhere else.
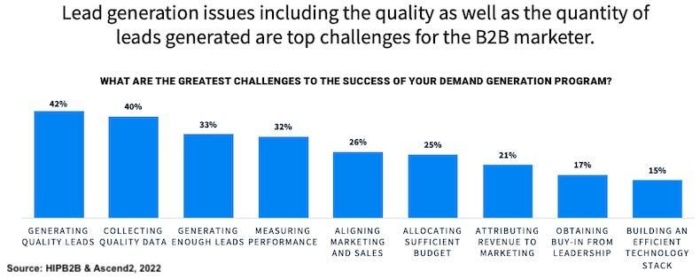
Content marketing is great at generating leads. In fact, content marketing costs 62% less than traditional marketing and generates about 3 times as many leads.
Different types of traffic result in different quality leads. For some brands, direct visitors will be the best quality. For others, it may be referral visitors. Given that generating high-quality leads is the biggest challenge for B2B marketers, it’s a good idea to track each traffic source to see which delivers the best leads.
It is also important to have a diverse number of sources for incoming traffic. If you’re getting all your visitors from one source, it can be risky.
For example, if all your traffic is coming from search and Google’s algorithm changes, you could lose all your traffic overnight. It’s best to keep your traffic diversified to protect yourself.
Metric 3. Your SERP Ranking
SERP stands for search engine results page. Your ranking is where you show up when someone searches for a relevant keyword.
This is what I see when I search for Neil Patel.
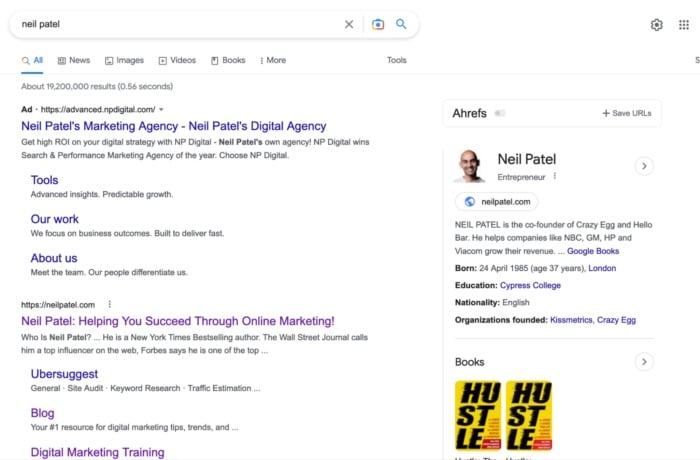
While your SERP ranking is not really a metric that you can calculate, it is one of the clearest indicators of how well your content is performing.
If Google likes it and references it highly, you’re doing it right.
Try searching for a few different combinations to see which of your posts or pages show up.
I show up as the second organic result when I search for “online marketing.”
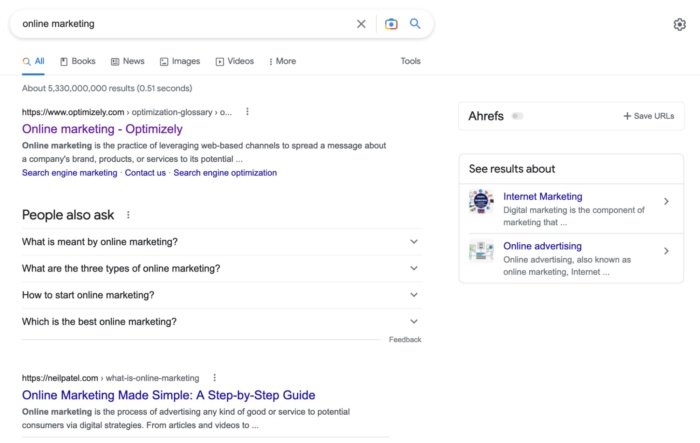
If your content is good enough, you may even have it featured in the snippet result at the very top of the SERP. This is sometimes called “position zero.”
Over time, you should see your SERP rankings improve as you build more backlinks and your site gains more topical authority.
You can also run SEO experiments to increase your ranking.
Here’s how you test SEO tactics:
Metric 4. Time Spent on Site
Have you seen the counters on Medium that show how long it takes to read the post in minutes?
It’s right at the top of the article.

There’s a reason Medium displays this figure. People like to know how long something is going to take before they get started.
Indicating the time it takes to read lets people know if they are reading something that they can finish before a meeting starts, or is best consumed at home in the evening when they have more time.
Medium calculates their read time like this:
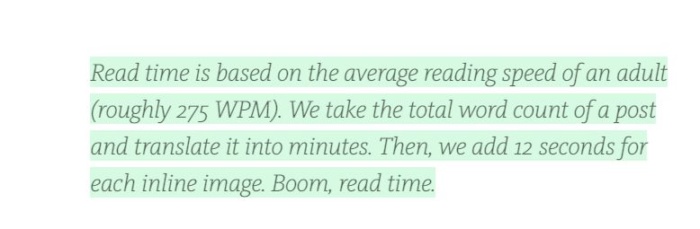
Why am I talking about reading time? Because time spent on site is another content marketing metric that you should measure.
The longer people stay, the more content they are consuming.
In Google Analytics 4, this is called Average Session Duration.
What you really want to see is users staying on your page for a similar length of time that it takes to read your content. That way you can tell they are reading the article in its entirety rather than just skimming.
You can see how people are engaging with a specific post by finding the URL.
Then, use Medium’s method to estimate a read time.
Compare the read time to the average session duration for that URL.
Do they line up? If they do, that means that nearly everyone is reading the article in its entirety.
It will never line up all the way. There will always be people who click, read a few sentences, and then leave.
That’s OK.
But if it’s clear that no one is making it to the end of your content, then it should be time to rethink how you are presenting it.
Metric 5. Pages Per Visit
Internal linking is a huge part of publishing successful content.
Great internal linking creates a flywheel where readers click through from one article to another, significantly increasing the time they spend on your site.
You should make it as easy as possible for people to click through and find more of your content.
You can read my complete guide to internal linking and discover what it can do for your site traffic.
The strategy is to deliver so much value in one article that when you link to a different article, people assume that it contains a huge amount of value as well.
You need to make it irresistible. Appeal to their sense of FOMO (fear of missing out).
The more clicks there are, the more your content is working, and the longer visitors stay on your site.
Metric 6. Interactions Per Visit
Even if a visitor doesn’t convert, all is not lost. You can still monitor their behavior on the site.
What exactly are they doing, how can you get them to do more of it, and how can you influence this behavior into conversions?
For example, if visitors are looking at a lot of different pages, spending a lot of time reading those pages, and leaving comments or reviews, they’re still interacting at a high level. Even if they’re not converting (yet) your goal should be to increase these interactions.
You can use a tool like Crazy Egg to help you understand where your visitors are clicking and how they’re interacting with your content.
You should also figure out how you can leverage those interactions into increased conversions, whether that’s downloads, subscriptions, purchases, or something else.
Metric 7. Value Per Visit
The value of each visit is a simple metric to understand, but much harder to calculate. Basically, it asks how much each visit is worth.
The simplest way to calculate this is by the number of visits divided by the total value created. Let’s use an e-commerce store as an example.
As you can see from recent data, the average e-commerce conversion rate in July 2022 was 1.92 percent.
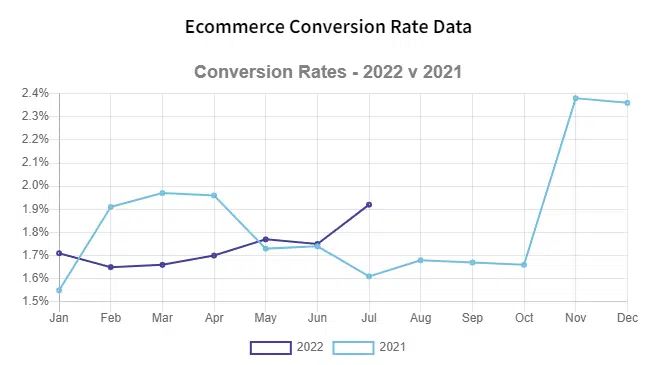
Let’s round that up to 2 percent to make calculations easier. If a store has a 2 percent conversion rate and the average purchase is worth $100, that means they sell about $200 for every 100 visitors. In other words, their value per visit is $2.
Sometimes this metric is difficult to calculate because the value comes long after a visit, or comes in an intangible form that’s hard to measure.
For example, blog visitors might create value every time they add a page view to your traffic if you’re selling advertising. But they also create an intangible value when they comment on your site, making it look more authoritative and engaged.
Similarly, visitors on e-commerce sites create value every time they purchase a product, but they also create a somewhat incalculable value when they leave a product review or when they tell their friends about the site through word-of-mouth.
Metric 8. New Visitors
As I have said above, every website needs new visitors to continue growing. That’s why it’s important to track how many people are coming to your website for the first time.
Equally important is understanding how many first-time visitors convert.
The way a first-time visitor interacts with your site is very different from how a returning visitor interacts.
To improve first-time visitor conversions, you have to isolate this metric from the conversion rate metrics of your loyal or returning customers. See what they’re interested in when they visit the website for the first time and how you can improve that experience.
You only have a few seconds to grab the attention of a visitor, so take a hard look at your first impression and compare it to your competitors. What message are you communicating?
Think about what matters to you when you visit a site for the first time. Chances are, you’re looking for factors like usability (how well you can navigate it), clarity (understanding what the site’s all about), and value (finding the information you were looking for).
How can you make the first impression of your site clear, useful, and valuable?
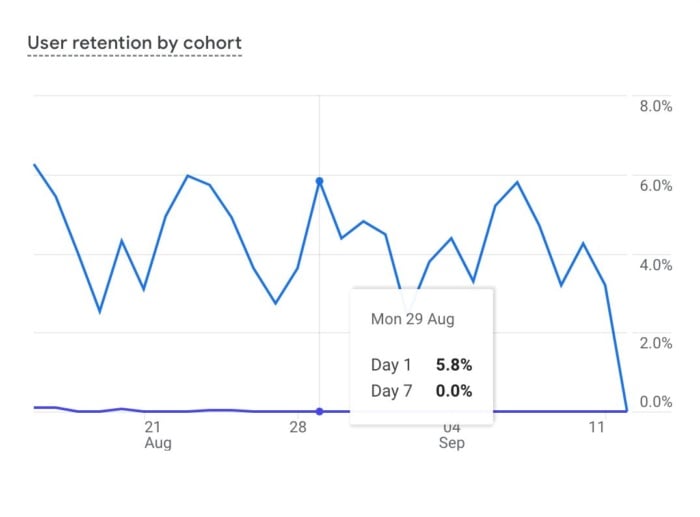
Metric 9. Returning Visitors
Content is a lot like a meal. The best honor you can bestow on your host is to go back for more.
And just like a meal, if you eat at a bad restaurant, you probably won’t go back a second time.
The ratio of returning visitors to total visitors is a key metric for answering the question, “Is my content good enough that people are coming back for more?”
Google Analytics 4 makes it easy to see how many visitors are coming back with its range of Retention Reports.
You will always have first-time visitors. In order to increase your traffic, you want new people coming to your site all the time.
But a viable content strategy has never been built upon attracting one-and-done visitors.
Again, there is no golden ratio for a website.
You can segment by the source of traffic and extrapolate a couple of predictions that would hold true.
Email is mostly returning visitors since they are people who are subscribed to your newsletter.
Social is a mix since a lot of people are engaged and follow me, but a lot of people come through links that other people shared.
The best way to look at the performance of your content is to look at direct traffic.
This is the traffic that comes from people typing your URL in directly.
Usually, people only type in a few letters before the browser suggests pages from the history.

Direct traffic will probably be almost entirely returning visitors.
The percentage of traffic from direct versus other sources will depend on your marketing campaigns and business model.
Instead of trying to increase the percentage of your traffic from direct, you should focus on the absolute volume of sessions from direct traffic.
If your volume is increasing, it means that people are coming back and your content is working.
Metric 10. Cost Per Conversion
This is the corollary to value per visit, and it’s one of the most important content marketing metrics you can calculate. It’s also known as lead generation costs or cost per referral.
It doesn’t matter if you have high conversions and high value per visit. If your costs are prohibitive, your net income might be zero or even negative.
In the example of the e-commerce store with a $2 value per visit, that might be great if their traffic is free. But if it costs them $150 per conversion, and each conversion only places a $100 order, the store will go broke quickly.
While trying to increase conversion rates, keep your costs per conversion and overall margins in mind.
<h3>Metric 11. Social Shares<h3>
I’ve said it over and over again. Great content is content that delivers value.
When you give someone something of value, the tendency is to share.
When people click the share button, they are saying to their network, “This is valuable, so you should look at it.”
Social shares also encourage users to read articles. When visitors see that an article is being shared a lot, they assume that the content has value. It’s a strong indicator that they should read it.
That’s why social shares are such an important metric to track. Each share is an opportunity for content to leave your audience and reach a new network of people.
Metric 12. Clicks from Social Platforms
Social sites also provide analytics for your posts. That data can be used as an extension of your analytics platform and can provide extra insights.
I’ll go into detail a little bit later about the tricky nature of the Facebook Like, but one insight that you should pay attention to is clicks.
Not the “post clicks” metric in the insights dashboard:
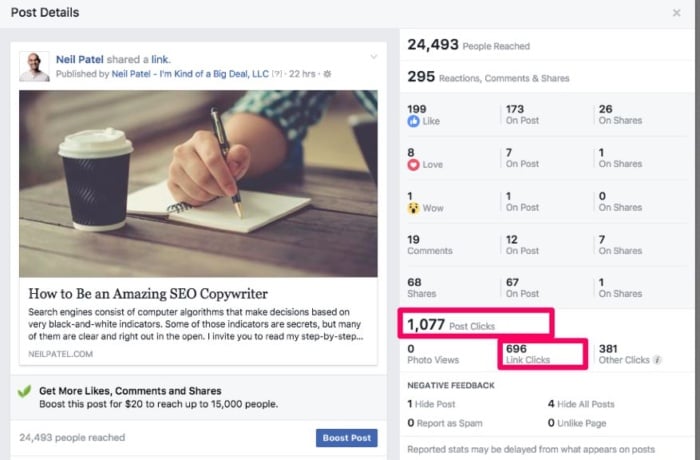
The “post clicks” are any time that people do anything, such as expand to read comments, click to see the image in the viewer window, or click play on a video.
What you want are link clicks.
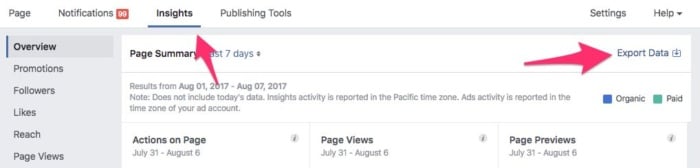
To get this information from Facebook, you need to do an export.
First, click the export data button.
Then select the format that you want. In this case, you should go with the Post option.
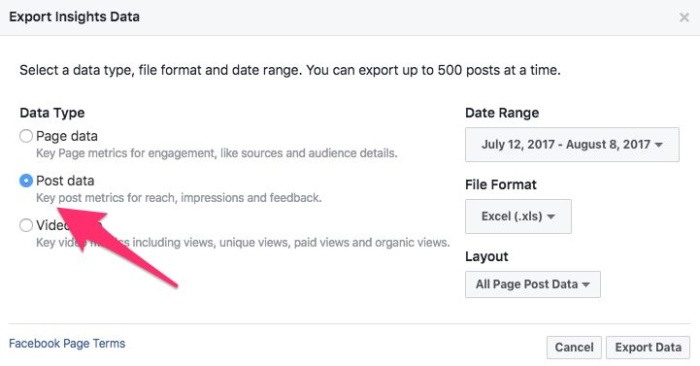
You can also select the file format that you want. This can be helpful if you have an analytics platform that you can export to.
The easiest option is just an Excel spreadsheet.
Open the Excel file that downloads.
Immediately, you’ll see the basic data.
Hidden under the tabs are the real insights that you are looking for. Find the Lifetime Consumption by Type sheet.
Scroll to the right until you see the column Link Clicks.
This is the true measure of people clicking through to your website.
And there is a reason why Facebook hides this information. It’s how you measure your CPC.
Facebook doesn’t focus on CPC.
They prefer talking about the community angle — particularly engagement. That’s why you see likes and interactions in the Insights dashboard.
But if you looked at Facebook in exactly the same way as display advertising, you would measure the performance by how much you spent to get one person to click to your site.
If you see that there aren’t many people actually clicking through to your site, you need to up your headline game.
Headlines are the game changer.
People scrolling through their Facebook feeds receive all kinds of content and information.
For example:
- Pictures of their friends’ babies
- Video of a dance group that someone commented on
- Mysterious status update from a sister-in-law
- An ad for the new Marvel superhero movie
- Your article
In order for your article to break through the noise, you need great writing. In particular, you need to have an awesome headline.
Headline writing is a huge part of getting people to read your content.
When someone is already on your site, the headline has less importance.
But when your content is reaching people when they aren’t on your site, you can measure the real performance of your headline.
If people are clicking through to your site, that’s a good indicator that your headline copy is working.
If you’re sharing and no one is clicking, you should immediately refocus on how you are presenting your content.
In addition to focusing on the Insights in the Facebook dashboard, you can also see the breakdown of traffic from social networks in Google Analytics.
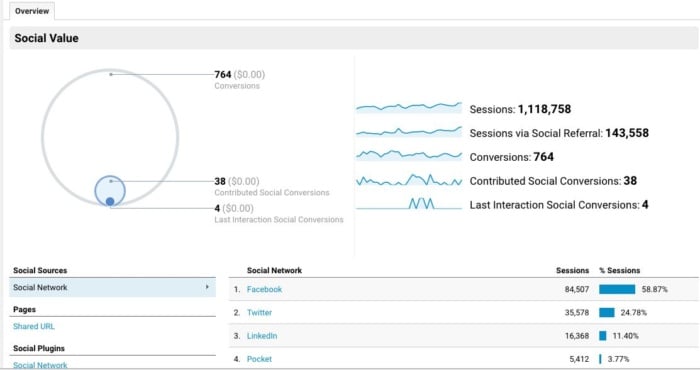
The Facebook Insights concern you, while the general traffic from Facebook in your Google Analytics includes traffic coming from all of the people who also shared your content.
Traffic from social can vary a lot. Maybe you got some press, or perhaps an influencer posted something about you.
This could drive extra traffic to your site.
Good news!
But it’s not related to a specific piece of content. Drawing conclusions can be counter-productive.
Facebook Insights gives you a very concrete way to measure.
Metric 13. Exit Pages
Finally, you need to figure out which pages are causing people to leave. In many cases, your final call to action or conversion may be on page two or three of a process. For example, you might want people to browse products, add one to a cart, then enter payment information.
If people are leaving before getting to the final step, you’re losing out on potential customers.
To solve this problem, dive deeper into your exits and figure out at what stage in the process your visitors are leaving or abandoning their cart.
There are, of course, lots of reasons, but by optimizing for your exit pages, you’ll start to see your conversion rate metrics increase.
Metrics That Can Distract You From Your Real Focus
Some content marketing metrics are less useful than others. Some can be downright distracting.
You won’t just waste valuable time tracking them, but you probably won’t be able to glean any useful insights, either.
Here are a couple of metrics to be wary of:
Bounce Rate
The bounce rate is the percentage of visits (sessions in Google Analytics) where people see only one page before leaving your site.
You might be thinking, “Isn’t that the opposite of the pages-per-visit metric that you mentioned earlier?”
Not exactly.
While you want to pursue a strategic internal linking strategy that enables people to discover more of your content, the bounce rate is a much more general metric that in itself can mean multiple different things that aren’t always clear.
For example, let’s say someone clicks one of your articles from Facebook. They spend five minutes reading the full article. Then they leave.
That visit counts as a bounce.
But it’s clearly a qualified visit.
You can see how it gets a bit murky.
Plus, bounce rate is also heavily affected by the UX (user experience) of your site. People leave for many reasons:
- They are looking for something they can’t find.
- The menu structure isn’t clear.
- They can’t search for what they are looking for.
Sites with poor UX will suffer high bounce rates.
This doesn’t mean that bounce rate is a useless metric, far from it. It’s just not a very strong indicator of content success because so many other factors contribute to it. So when you are looking for metrics to measure your content’s success (and only content) put the bounce rate aside.
Facebook Likes
It’s a question that everyone in digital struggles with: “What is a Facebook Like worth?”
On one hand, it’s clearly an engagement. On the other hand, it’s not a conversion. It might not even be a click.
And with more brands and businesses congregating on Facebook, the user experience has been increasingly controlled by the Facebook algorithm.
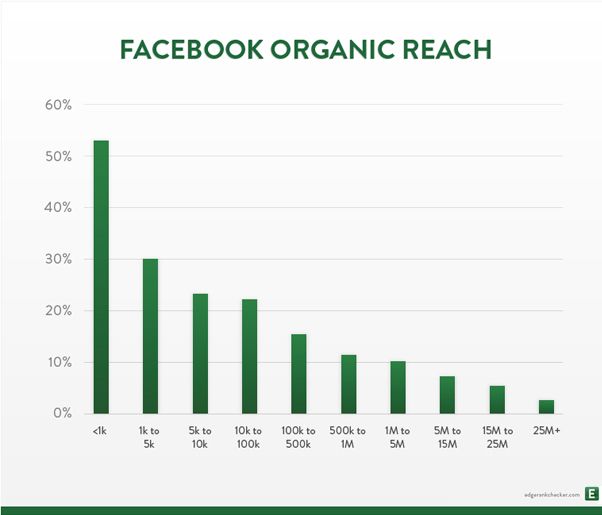
And that meant a significant drop in organic reach. In 2012, the average organic reach of a page was 16 percent. Today, it’s more like 8.6 percent.
Worse still, your organic reach declines dramatically as you get more followers. It’s sad but true.
Facebook has become a pay-to-play environment.
Not all is lost, however.
The best way for content to break out of the downward spiral is to gain traction.
Traction means garnering a lot of likes and comments rapidly so that the algorithm identifies it as high-performing and delivers it to other people.
But that’s where the value of a Like ends.
Facebook Likes by themselves are meaningless when you’re trying to track your content’s success.
Like I mentioned before, the true social metric is the share. A share is someone taking your content and pushing it out to their audience.
A click is a visit.
A like is something else. People like things automatically, sometimes even without reading.
So while it’s cool to see people liking your content on Facebook, try not to take it any further than that.
At the end of the day, your team only has so much time to parse different metrics and incorporate them into your future planning. These last couple may be nice to look at, but might steer your content marketing astray if you look too deeply into them.
FAQs
There are plenty of content metrics you can track. Traffic, time on site, SERP keyword ranking, returning visitors, and interactions per visit are some of the most important.
You don’t have to analyze content metrics every week. Usually a monthly report with growth compared month-by-month works well.
Pages per visit means how many pages a single user visited in one session.
If you’re using content to drive traffic, tracking keywords is vital. By tracking the changes in your content’s rankings, you can see how useful it is in the eyes of Google. You can also take steps to improve a piece if it is close to ranking on the first page.
Conclusion
Now that you understand how to measure content success, I recommend putting together a spreadsheet to track your metrics over time.
In most of the cases cited above, there are no absolute values that you can shoot for.
The Internet is a space that constantly changes, and a great strategy today might not be a great strategy tomorrow.
The best you can do is execute your current strategy, deliver content with value, and try to keep your metrics in line month after month.
What metrics are most important for you in evaluating the success of your content?

See How My Agency Can Drive More Traffic to Your Website
- SEO - unlock more SEO traffic. See real results.
- Content Marketing - our team creates epic content that will get shared, get links, and attract traffic.
- Paid Media - effective paid strategies with clear ROI.
Are You Using Google Ads? Try Our FREE Ads Grader!
Stop wasting money and unlock the hidden potential of your advertising.
- Discover the power of intentional advertising.
- Reach your ideal target audience.
- Maximize ad spend efficiency.