
 Heads up: Tickets are now available for our Mogul I/O London event on May 30th, in partnership with Marvel!
See more details and reserve your spot today.
Mogul I/O is ChartMogul’s first ever event series, running in San Francisco, New York, London and Berlin. The New York event was an all-round success, so if you came out to see us then thank you!
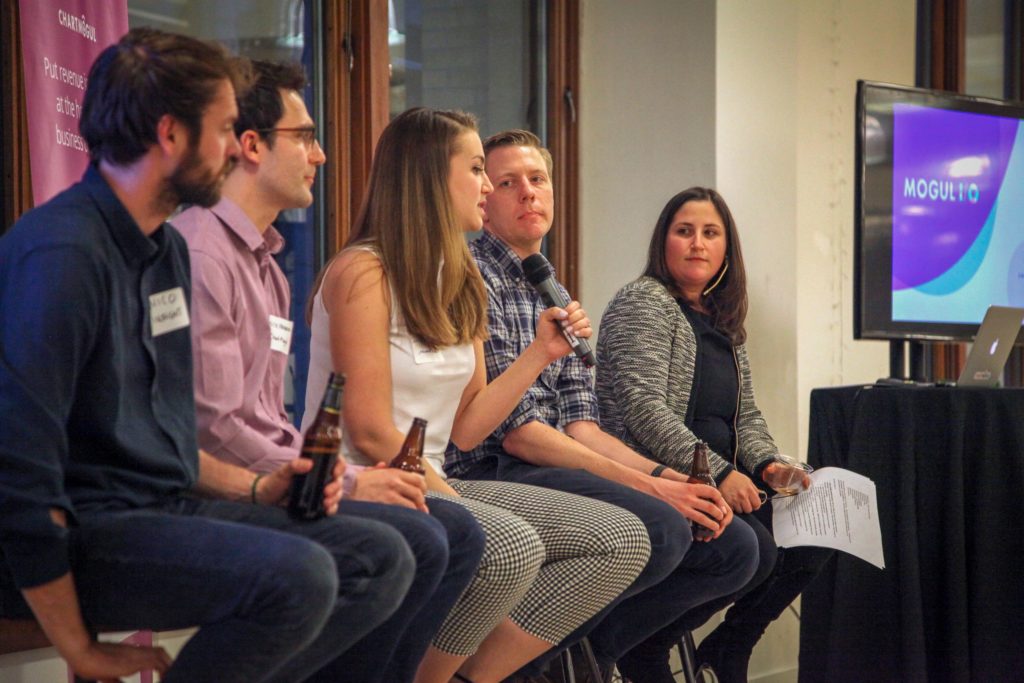
This post features a summary of the event’s panel discussion along with highlighted quotes from our panel members and key takeaways on each topic. Enjoy!
The contributors
- (Moderator) Rachel Koplowitz — CEO, Honey
- Michaela Lehr — Director FP&A, Movable Ink
- Dave Sheen — SVP Finance, Vestwell
- Nicolas Wittenborn — VP, Insight Venture Partners
- Nick Franklin — CEO, ChartMogul

Team alignment around revenue metrics and building a data-driven team
For Movable Ink, it’s all about account expansion
Today, Movable Ink is about a 200-person team. Michaela maintains that aligning people around account expansion is very important because it drives the correct behavior and culture.
Michaela wants everyone at Movable Ink to care when companies walk away, or when accounts expand due to upsell. As a result of this, the management team defined “net expansion” as a key focus metric. There are specific goals set for Annual Run Rate (ARR) every quarter and a proportion of sales compensation is based on net expansion.
“There’s a huge difference when your churn starts to fluctuate up, in terms of what that means for ARR — your revenue. Since ARR is the lifeblood of your business, you want that to grow. That was a big thing we did to align our exec leadership, customer success and sales teams around expansion.”
Michaela Lehr, Movable Ink
For other teams like R&D and engineering, it’s more about OKRs and more traditional alignment objectives. Michaela’s team is really thinking through how to create a product that’s not only integral to the companies they’re selling to, but also what that means for quarterly roadmap goals and feature releases.
Vestwell deployed a prominent large-screen dashboard in its office
Vestwell moved into a new office in April. The team immediately erected a large screen in the middle of the office displaying internal metrics. Because Vestwell is a hybrid of SaaS mixed with other components, it’s easiest to align the company around “assets under management” as a metric. This is the compass metric and the whole team can see that.
As Dave explained, the screen felt overly sales driven when it was first installed — as a result it felt like if they didn’t meet the sales goals, the whole team would look over at sales and give them the “stink-eye.”
Addressing this issue, version two of the dashboard still shows all of these core goals, but it now rotates through different screens of metrics. One screen is sales goals, followed by ops goals (e.g., app response times) and development goals (e.g., sprint progress). The idea here is to make all of the different teams feel connected to the metrics, rather than just sales.
At ChartMogul, rapid team growth leads to goal changes
As CEO Nick Franklin explains, ChartMogul is currently thinking about how to deal with having almost half its employee base on the engineering team, with many new arrivals in a short space of time. How do you make engineering contributions work toward company goals?
In the early days, everyone had access to the company’s ChartMogul account and the whole team rallied around MRR growth and churn. Now the team has grown much larger, Nick’s management team is exploring how to align engineering with MRR growth. This includes potentially rolling out OKRs in the near future.
“It’s quite easy if you run a support team to be metrics-driven. That team is really data driven from the start — there’s a lot of data built in, in the form of NPS, ticket response times and more…It’s more challenging in engineering, when you’re looking at paying down tech debt and more abstract projects.”
Nick Franklin, ChartMogul
Revenue is king, but monitoring churn is critical
So what’s the North Star metric for us at ChartMogul? As Nick states, it’s primarily MRR. Since launching a free plan some months ago, the team needed to devise some other ways to measure the success of Freemium accounts — it’s important for the team to try to understand the longer-term value of a free customer.
Michaela’s North Star metric at Movable Ink is “without a doubt” ARR. Understanding churn is a huge focus for the team in addition to this:
“You can have the best sales team, but if you have a leaky bucket you’re losing a lot of value from your recurring revenue base.”
Michaela Lehr, Movable Ink
Nico Wittenborn shares his investor point of view on North Star metrics, but here’s the thing: It depends on the business. In SaaS, certainly ARR, MRR, churn and expansion are the most important. Helping entrepreneurs see the value of metrics in the first place is a bigger focus for Nico, though — it’s not uncommon to find founders who just aren’t bought into the measurement part:
“There are some great entrepreneurs…they’re incredible entrepreneurs but they just don’t care about the numbers…they don’t know how to talk about it and align the company around it so much.”
Nicolas Wittenborn, Insight Venture Partners
In Nico’s opinion, a data-driven culture must come from the founders. As an investor, one goal is to get entrepreneurs to have a clear understanding of this — getting them to focus on one KPI that leads the company forward.

Data reporting stacks and tools
Michaela’s team at Movable Ink uses a lot of disparate systems for recording and reporting, so data accuracy can be difficult. It’s important for someone to own the numbers, and in the case of Movable Ink the responsibility comes down to Michaela’s team. When it comes to data accuracy, there’s no silver bullet — rather a lot of checks throughout the whole stack. Getting systems to talk to each other is a challenge for many SaaS startups.
Dave has felt the pain of maintaining a manual dashboard for data reporting, and spends a lot of time into keeping this up to date. It’s all done by a combination of tools — some feed directly into the dashboard — and others go to email where they’re manually entered into the system. This was increasingly messy for him!
ChartMogul has recently built a team to manage the company’s integrations with partners, and as Nick explains, having dedicated engineers focusing on specific areas of the business is a luxury. He hopes to have engineers entirely focused on the company’s internal tools before long.
What’s the number one tool (excluding ChartMogul) you couldn’t live without?
Dave: “Excel! I’m an Excel junkie.”
Michaela: “Salesforce, especially when it’s leveraged correctly it’s a very powerful tool. Being able to map the customer journey and have metrics against that is really important.”
Nick: “As a product-focused founder, Trello.”
Nico: “ChartMogul, of course! But Salesforce is a consistent thing that is so much more than just a CRM now — it sits on top of the whole platform. Really depends on the company though.”
In Nico’s opinion, there’s a huge opportunity for tools to manage data processing right now — someone needs to build this! Even independently of GDPR, there’s also what’s happening with Facebook. People are increasingly sensitive about what’s happening with their data and how it’s used. It’s quite possible that in a couple of years a tool to manage personal data could be really successful.
Getting to the real “why” behind churn
Movable Ink chooses to put a lot of focus on customer expansion, which includes both the upside as well as downside. But Michaela thinks it’s important to face churn head-on, too, in order to understand it:
“Churn is an ugly thing, but you have to look it in the face and you have to understand it. If you understand your weaknesses that’s how you grow as a company.”
Michaela Lehr, Movable Ink
Movable Ink has been focusing on categorizing churn each quarter. Basic categorization is nice, but you can read into it on a much deeper level if you tie these categories back to the customer journey. Michaela’s team originally had broad, basic churn categorization, but they worked really hard to break down the customer journey and figure out what actually happened to make an individual customer churn.
There are so many things across the entire journey that can happen to a customer to start them on a downward spiral towards churn — both external and internal factors. Michaela maintains that once you build knowledge around this journey — saying “here’s why it happened, here are the levers,” you’re actually able to put an action plan in place.
“People see churn as an ugly thing…but they’re not scared of it any more. If you don’t measure it, you can’t prove it.”
Michaela Lehr, Movable Ink
How do you get down to a single churn reason when there are often complex issues leading to churn?
ChartMogul’s answer to this is to create both high-level categories for churn reasons, as well as highly specific reasons. This gives the team both the ability to group and categorize as well as digging into the more actionable reasons on an individual level.
A quick tip from Michaela on this: It’s helpful to try and get to a “five-second elevator pitch” for why the customer churned.
Is there such thing as “too data driven”?
As Michaela explains, you have to be human at the end of the day. You can be driving yourself crazy looking at the numbers, but you have to take a step back and remember that you’re working with real people — and these people have emotions that drive the decisions they make and the things they do.
“…Then you have to take a step back and think ‘I’m a person, and these are people. How do I think about this on a human level?’… and use that to inform your decisions.”
Michaela Lehr, Movable Ink
Dave believes we’re lying to ourselves all too often when telling stories around financial data:
“You can pretty much make any financial model look like it works, if you just throw the right assumptions in there. I’ve seen countless examples of amazingly rosy projections and how companies are going to get to a billion dollars in three years… it rarely comes true.”
Dave Sheen, Vestwell
What happens when it’s too early to have any reliable data to go on?
Nico was involved in the early-stage investments that Point Nine Capital made in both Honey and ChartMogul. Neither company had much in the way of numbers at the time.
In the case of ChartMogul it was much more about the founder — Christoph Janz had a strong connection with Zendesk (Nick’s former employer), so prior feedback on Nick as an entrepreneur helped them make a decision. The metrics in this case were not so relevant.
In the case of Honey, it was much more about the product and early adopter engagement with the product. Honey allows people in a company to engage more with each other, and the product encourages a high level of activity. Nico was interested in benchmarking the activity and engagement of the early customer accounts, and focusing on how engaged these people were with the product.
“The earlier you go, the more micro your lens gets — it’s more about talking to customers and backing that up with some data around the engagement with the product.”
Nico Wittenborn, Insight Venture Partners
What can people read or attend to be better at data and metrics in SaaS?
Nick: “I’ll promote a SaaS event in Dublin called SaaStock — it’s a lot of fun and a huge learning experience!”
Dave: “If you haven’t read David Skok’s blog, he’s the OG of SaaS. Nobody does a better job of explaining the basics around SaaS metrics.”
Michaela: Also the SaaS Metrics 2.0 post by David Skok — just read through the entire stack and the comments at the end too!