In 2021, ChartMogul experienced a transformative shift in data strategy when we introduced a dedicated data engineering team. Decision-makers still rely on ChartMogul charts and segments to analyze our subscription data, but as we started collecting a lot more different types of data from a lot more sources, we needed a sustainable data management plan for our growing team.
Updating the data engineering stack streamlined data processing; reducing the time and effort invested in manual data handling. Adding automation and integration capabilities enhanced the overall accuracy of our analyses, providing more reliable insights for strategic planning and improving collaboration between teams.
Pulling back the curtain, I want to share the dynamic evolution of our data engineering stack, and explore our current configuration and the significant advancements made since inception.
- The challenge
- The solution
- Data warehouse
- ETL processes
- How we visualize data
- Future plans, closing thoughts
The challenge: why we needed a data engineering team
ChartMogul integrates with various billing systems, normalizes and aggregates the received data, and then visualizes SaaS metrics into charts and tables.
Internal ChartMogul teams heavily rely on ChartMogul to:
- Track our progress towards growth targets
- Segment customers by ICP, geo, etc.
- Analyze our performance and identify problem points
- Highlight the best performing lead sources
- Run sales forecasting
- Facilitate strategic decision-making
- Run our sales process and communicate with customers
In addition, ChartMogul teams use various tools to manage go-t0-market functions, including Zendesk, Customer.io, and Livestorm. Valuable customer data from these tools is combined, aggregated, and enriched with subscription data from ChartMogul.
However, teams were relying on a manual and disjointed process to combine this data, using file exports and Google Sheets. This process proved increasingly inefficient as our data needs expanded and analyses grew in complexity, leading to a lack of real-time accessibility to critical data points.
As the application continued to evolve and grow, the product team didn’t have great visibility on feature usage. They mostly relied on Google Analytics, which allowed for high-level page and visit tracking of the application pages with origin filters, but lacked detailed information about users and activities in each account.
Success and product teams also utilized external platforms to track users and activities in each account, but they were missing insights into which account segments used specific functionality and adopted new features. Ahead of big releases planned at the time (destinations in 2022 and CRM in 2023) we needed a holistic view of our product usage, enriched with subscription and enrichment data from the various platforms we use.
To overcome these challenges, establishing a data engineering team was a strategic commitment. The goals for this team include implementing data ingestion, transformation, and storage, automating processes, ensuring data accuracy, and fostering a more agile and informed decision-making culture across our organization.
The solution: our data engineering stack
A data engineering stack encompasses the tools and technologies employed to collect, process, and analyze data efficiently.
The modern data stack, in particular, represents a paradigm shift, embracing cloud-based solutions, automation, and integration to meet the escalating demands of data-driven decision-making.
A typical data engineering stack includes the following elements and functions:
- A data warehouse where raw, combined, and aggregated data is stored and accessed
- ETL processes which extract data from databases, APIs, external platforms, and tools and load them into the data warehouse
- Scripts to combine and aggregate data into clean tables and views
- Data visualization and presentation tools, and enrichment to platforms
- Orchestration framework to frequently glue and execute all the aforementioned processes
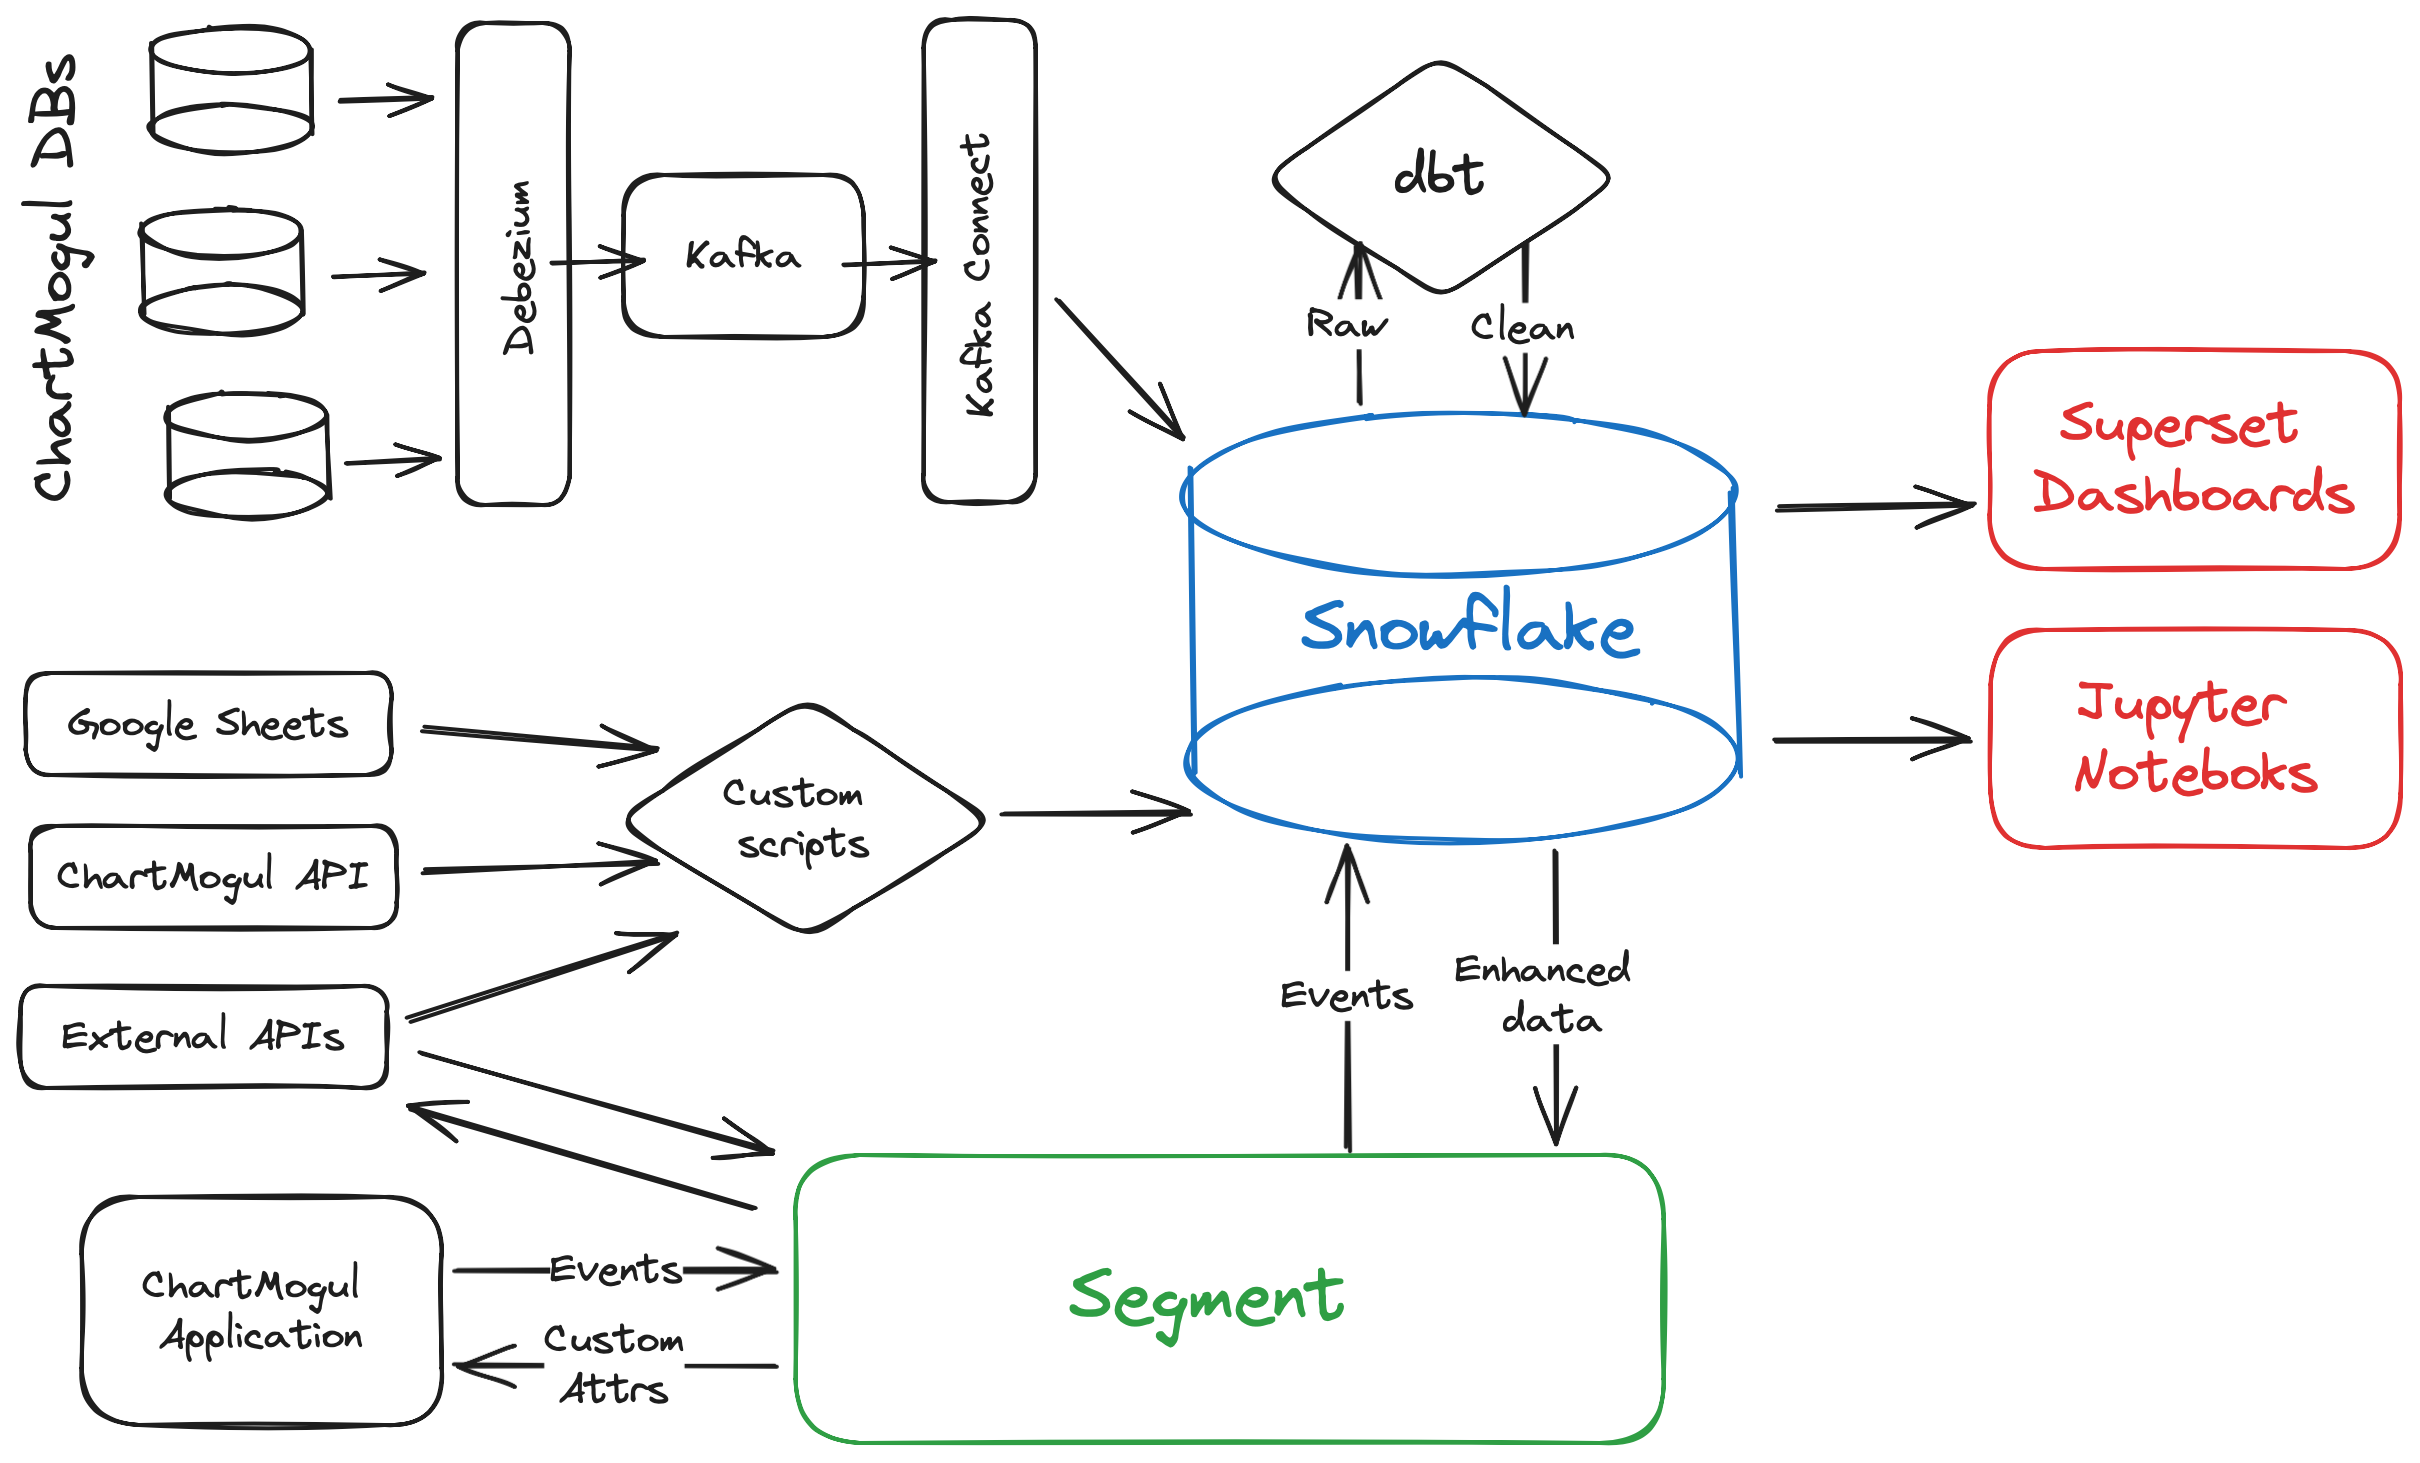
ChartMogul’s data engineering stack is visualized in the figure below.
Our ETL processes consist of custom scripts, elements of the Apache Kafka ecosystem (Kafka cluster, Kafka Connect, Debezium), and Segment, with Snowflake data warehouse as our persistent storage layer.
We transform data using a data build tool (dbt) and then visualize all key metrics using Superset dashboards, with further analyses performed in Jupyter notebooks.
Data warehouse
Before the team was set up, most of our data was exported in CSV files, manually uploaded to Google Sheets, and stored in an S3 bucket. The company’s sole analyst at that time used AWS Athena to query them from the S3 bucket, created additional materialized views to combine and aggregate them, and visualized them into dashboards with Superset using its AWS Athena connector.
Selecting a data warehouse was one of the first big decisions for the newly formed team. The aim was to ease data access across the company and allow data engineering functions to scale. We narrowed down a few cloud-hosted alternatives and agreed on a selection process based on the following requirements:
- Ease of maintenance and use, considering a team of two data engineers and two analysts
- Rich functionalities, integrations, and adoption with other tools
- Rock-solid performance and scalability, with low costs
Considering all the factors above, we selected Snowflake and it quickly brought value to the team. We shared our story of moving to a new data warehouse in much more detail with the Snowflake team.
Snowflake is currently the source of truth for all our data sources and internal data analytics. It was quickly utilized to deliver nine data destinations in 2022 and serve one of the most demanding ChartMogul application charts.
Extract, transform, load (ETL) processes
The initial data sources to sync included the following:
- Most tables from the core Postgres databases, including normalized, derived, and aggregated data
- Specific endpoints of ChartMogul’s Import and Metrics APIs
- API endpoints from external platforms, such as Zendesk, Customer.io, etc.
- Google Sheets maintained by specific teams
The list has evolved and grown since then, with tools being added, replaced, and removed. Most notably, we integrated with Segment, which was selected by our revenue operations (RevOps) team as our customer data platform (CDP).
For all non-Postgres-related functions, we use simple Python scripts to call the relevant API endpoints, quickly clean up and enhance data, and store it in Snowflake.
Initially, these were implemented in Jupyter notebooks and manually executed by our analysts whenever they needed to deliver a report. Nowadays, these are packaged and deployed in docker images, and executed via AWS lambda or EKS pods each day.
Historically, syncing our Postgres databases with Snowflake was a challenging task that required significant team resources. We used our daily AWS RDS snapshots and loaded them daily to Snowflake tables. This was useful to build all other functions and eventually, the final models used in reporting and data destinations. However, the process was expensive and limiting as the team couldn’t update the dashboards and data destinations more frequently than once per day.
We needed a real-time solution that wouldn’t rely on static snapshots but could continuously extract real-time changes from Postgres and feed them into Snowflake.
To achieve this, there are a few commercial and open-source ETL platforms, such as Fivetran and Airbyte. After evaluating them, we determined that they wouldn’t fulfill requirements deriving from our used database sharding and partitioning scheme.
Instead, we designed and implemented a custom solution based on Kafka, Debezium, and Kafka Connect. We enabled logical replication AWS RDS instances, deployed Debezium and other Kafka connectors in our Kubernetes cluster which consume all real-time changes in Postgres tables, and stored them in relevant Kafka topics in our AWS MSK cluster.
Finally, we use the Snowflake Kafka connector to move data from Kafka into Snowflake tables. With this setup, we have a continuous stream of Postgres data into the data warehouse.
How we process and visualize data
In our data engineering endeavors, dbt stands out as a crucial tool for orchestrating SQL-based transformations. Through a modular approach, dbt allows us to encapsulate business logic within individual models, promoting collaboration and code maintainability as we construct a robust data transformation pipeline.
Our dbt use cases include:
- Union and deduplicate raw data coming from Kafka and our sharded Postgres databases
- Normalize data coming from various external systems and Segment
- Combine and aggregate tables, calculate various customer metrics, and lay the groundwork for actionable insights
To effectively convey insights, we leverage Superset as our visualization tool to create dashboards. These dashboards, born from the transformed and aggregated data, offer a user-friendly interface for stakeholders to interact with and extract meaningful insights from complex datasets.
Armed with interactive Jupyter notebooks, our data analysts and scientists delve into the nuances of the transformed datasets. These notebooks serve as dynamic environments for conducting sophisticated analyses such as our annual SaaS Benchmarks report, and recent SaaS Growth report, statistical modeling, and iteratively crafting intricate data visualizations.
In essence, our data engineering stack relies on dbt for orchestrating SQL transformations, interactive notebooks for in-depth analysis, and Superset dashboards for streamlined dissemination of insights.
These tools collectively empower our team to navigate the intricate landscape of data engineering, ensuring that technical insights are not only generated but also effectively communicated to stakeholders throughout the organization.
Future plans and closing thoughts
Looking ahead, our data engineering journey is set for continued evolution and innovation. As we navigate the ever-changing landscape of data integrations, we anticipate further enhancements and optimizations to our stack. The integration with Segment, our chosen CDP, opens up new possibilities for enriching our datasets and extracting deeper customer insights. The adoption of a real-time data integration has been a game-changer, allowing us to move beyond static daily snapshots to a continuous stream of Postgres data into Snowflake.
As we fine-tune our bespoke solution built on Kafka, Debezium, and Kafka Connect, we are actively exploring ways to leverage additional features and optimizations utilizing real-time data. We are currently exploring a proof of concept with n8n as the automation tool, allowing teams to write their own workflows and perform real-time actions.
Our commitment to staying on the cutting edge of data engineering ensures that our systems remain agile, scalable, and responsive to the dynamic needs of our organization. Our data engineering stack stands as a testament to the iterative nature of technology adoption and the need for tailored solutions to meet unique challenges. As we continue to push the boundaries of what’s possible, we’re excited about the prospects of further automation, enhanced analytics capabilities, and the continuous refinement of our data engineering practices.
Stay tuned for more insights and revelations as our data journey unfolds, driving us toward a future where data is not just processed, but harnessed for strategic decision-making and innovation. And if you liked this post, check out the story of how migrating our database eliminated data processing incidents.