Mixpanel for User Analytics: Features, Pricing, and Review

Looking for an effective user analytics tool and wondering if Mixpanel is the best option for your SaaS company?
With numerous Mixpanel alternatives, it can be challenging to make a final decision.
In this article, we’ll delve into precisely that – helping you determine whether Mixpanel is the ideal choice for your user analytics needs. We’ll explore its features, pricing, and offer a comprehensive review to aid in your decision-making process.
Let’s get started!
TL;DR
- Mixpanel is a good choice for user analytics and it comes with features such as user segmentation analysis, survey analytics, user journey mapping, and behavioral analytics.
- Let’s look at the most common scenarios where Mixpanel is NOT the right tool for your user onboarding needs and you should be looking into using a different one:
- You need better customer support: Mixpanel has been criticized for its poor customer service. You can have a hard time getting the software problems fixed quickly since you might rarely get an instant response from the support team.
- You want behavior-driven product tours: you are seeking to guide users through their product’s features using behavior-driven triggers, a solution like Userpilot is more appropriate.
- You want advanced segmentation: You can create targeted user segments based on specific parameters such as pricing plans, company, location, required actions, NPS score, and more on Userpilot.
- If you’re looking for a better option for user analytics, Userpilot exceeds both functionality and value for money compared to Mixpanel.
- Ready to see Userpilot in action? Schedule a demo today to explore its powerful user analytics capabilities firsthand.
![]()
Looking for a Better Alternative for User Analytics? Try Userpilot!

What is Mixpanel?
Mixpanel is a simple and powerful product analytics tool that allows product teams to track and analyze in-app product engagement. It allows your team to see every moment of the customer experience clearly, so you can make changes that work.
In addition, it lets you explore data freely without using SQL. Set up your metrics to measure growth and retention. Slice and dice data to uncover trends and see live updates on how people use your app.
Must have features of user analytics tools
Choosing the right user analytics tool is important for understanding your customers’ behavior and optimizing their journey. Here’s what you should look for:
- Product usage insights: For an in-depth understanding of user experiences, ensure your tool captures in-app behaviors and tracks progression across various user journey touchpoints. Specifically, look for features like custom events, feature tagging, heatmaps, and session recordings.
- User segmentation: Select tools that allow segmentation by factors like jobs to be done, demographics, or in-app actions, and then enable you to visualize their behavior for identifying common themes.
- Feature engagement: The chosen tool should show trends in feature engagement and adoption. This will help identify popular features and ones you’re better off sunsetting.
- Funnel analysis: So you can visualize the users’ journey through your product. By identifying where users get stuck or leave, you can strategize how to streamline their path to completion.
- A/B testing: For comparing different product flows to determine what works best. This helps in making informed decisions based on real user responses.
Mixpanel features for user analytics
Mixpanel provides deep, granular, user-level analytics that can help teams build profitable products.
Here are the features available for user analytics on Mixpanel:
- Data collection and storage: Mixpanel seamlessly gathers data from diverse sources, establishing a consistent inflow on monthly, weekly, and real-time bases. This data, meticulously stored, remains accessible and secure, encouraging scalability.
- In-depth data analysis: Mixpanel uses machine learning to mine user data for insights that transcend conventional queries. These insights hold the potential to reveal unexplored avenues for product enhancement. The tool acts promptly, notifying product teams of anomalies and suggesting adjustments to amplify user value.
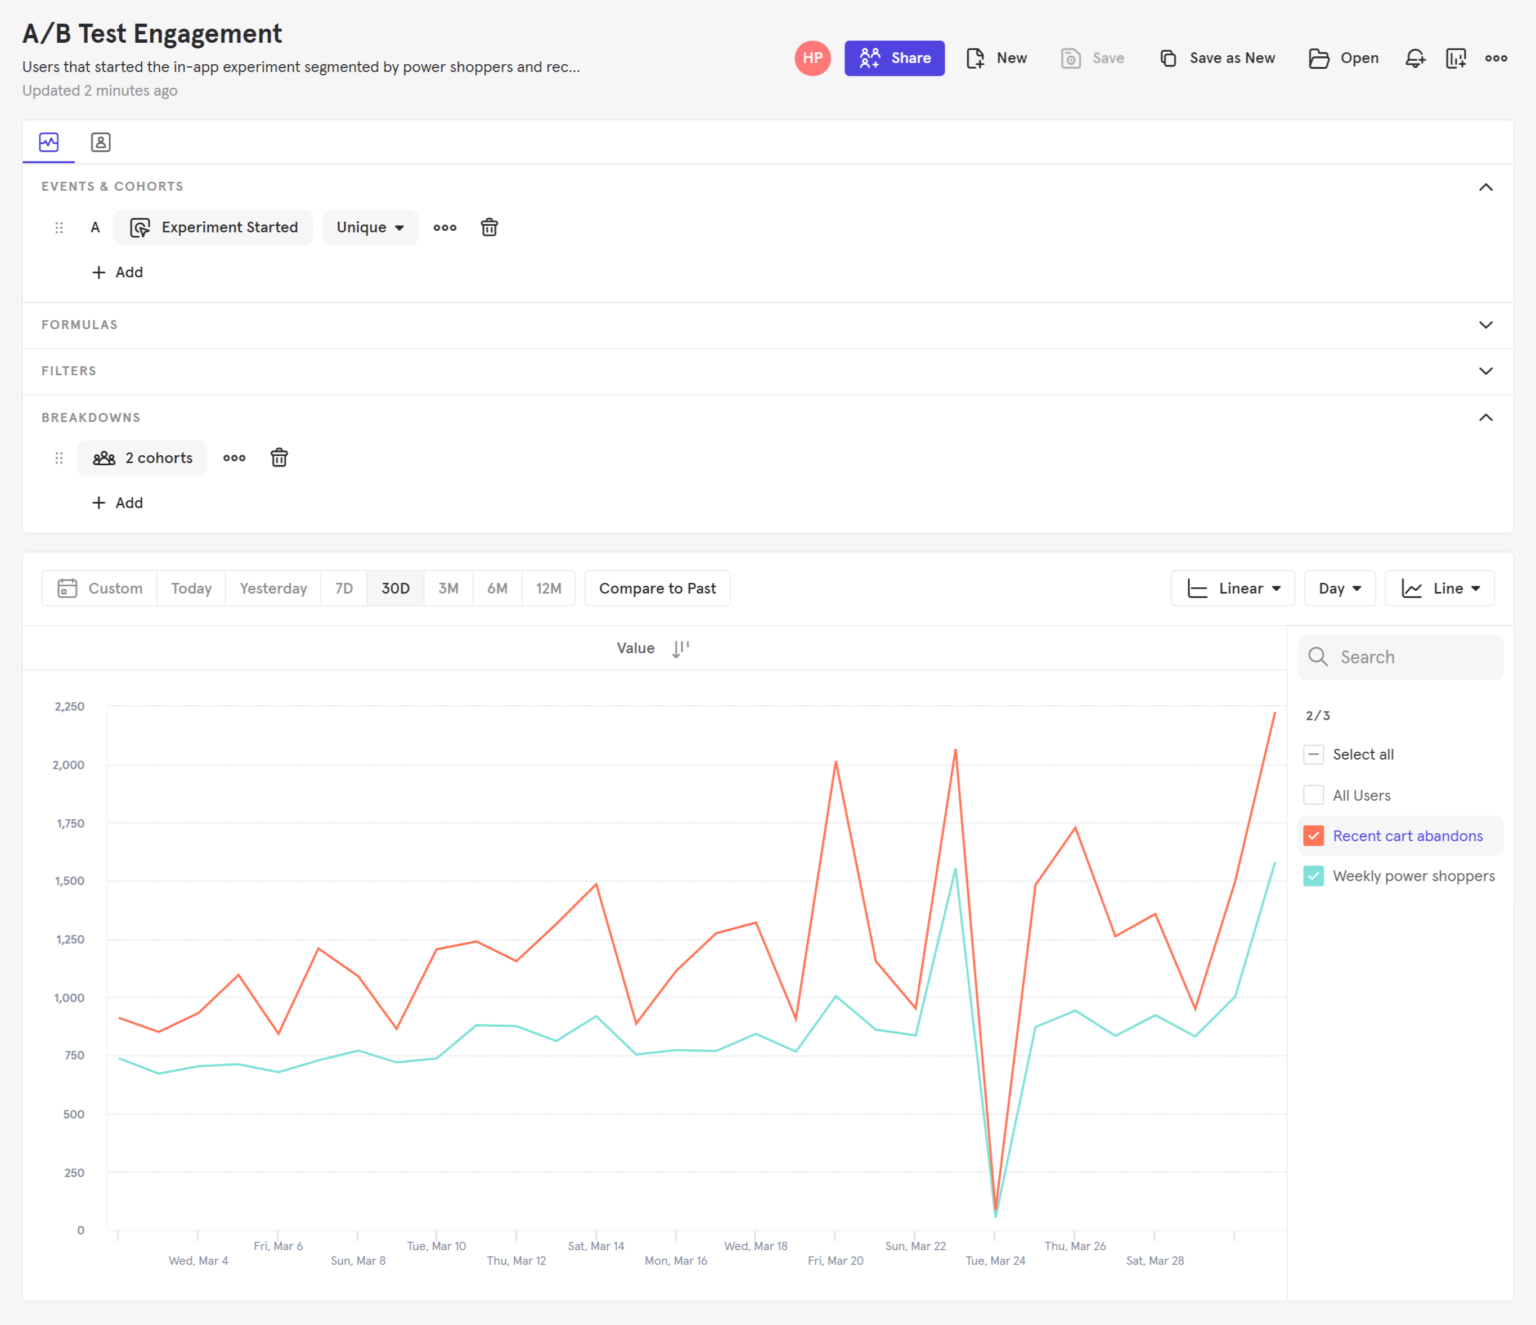
- A/B and multivariate testing: Mixpanel provides a suite of tools for A/B and multivariate testing. Testing new forms, text, images, and workflows can help analyze hypotheses and improve the user journey.
Mixpanel’s user segmentation analysis
User segmentation is the process of separating users into distinct groups or segments.
What features serve as a bedrock for Mixpanel’s functionality on segmentation analysis:
- Custom properties: By using custom properties, you can create more refined segments that align with your business goals and user characteristics. Custom properties let you combine existing properties into new properties on the fly, using a simple Excel-like formula language.
- Segmentation logic: An expression or logic consists of a property combined with one or more operators that can perform mathematical operations, logical operations, or typecasts. Mixpanel provides segmentation logic that allows you to create complex user segments using a combination of attributes, events, and properties.
Mixpanel’s survey analytics
Survey analytics is the process of interpreting survey responses to get valuable insights. Mixpanel is not a survey analytics tool. It is primarily focused on tracking user interactions and behaviors within digital products to provide insights for optimizing user experiences.
While Userpilot offers product analytics use cases, it also has extensive features allowing you to create, send, and analyze in-app surveys with advanced configuration.
Mixpanel’s user journey mapping
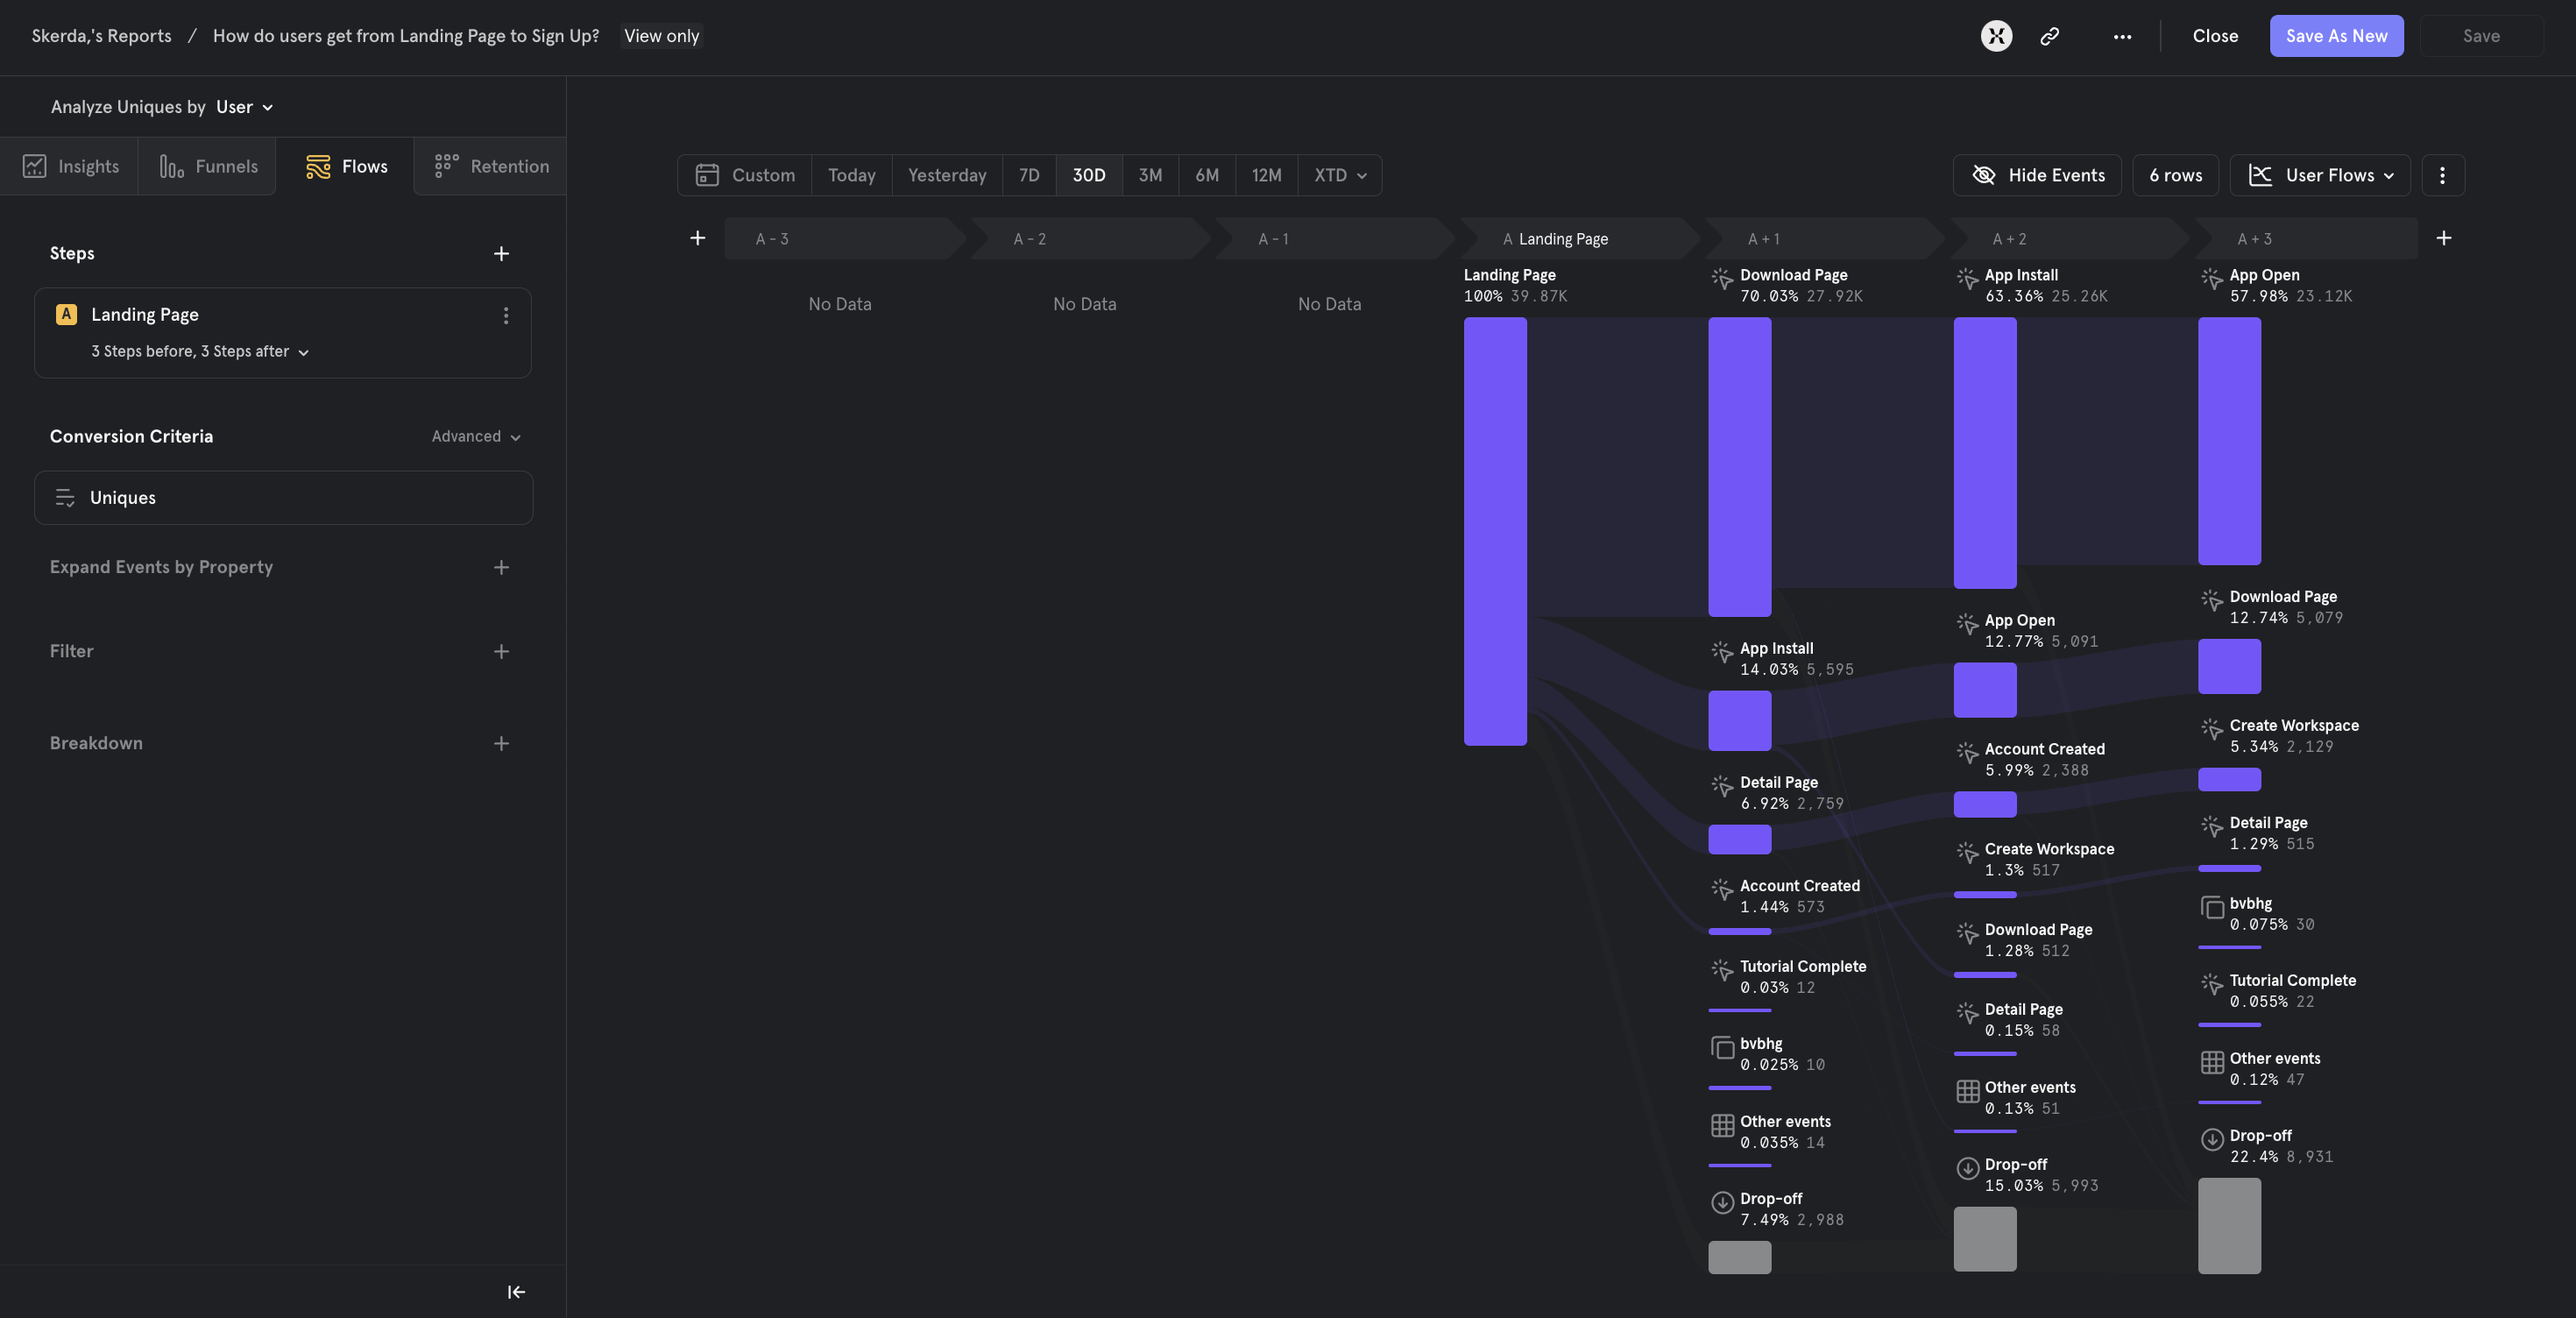
You can utilize Mixpanel’s Flow report for user journey mapping. It provides insights into user behavior by identifying the most common paths users take to or from any event. It helps you understand sequential event performance and analyze drop-offs or unsuccessful behavior in your product.
To create a flow chart, begin by identifying the initial event and specifying the desired number of steps preceding or following that event or both (i.e. view paths for 3 steps before and 3 steps after users enter the landing page). Then you can either just proceed or add more filters (i.e. by browsers) or step breakdowns (i.e. by country) to your flow queries for a more granular analysis.
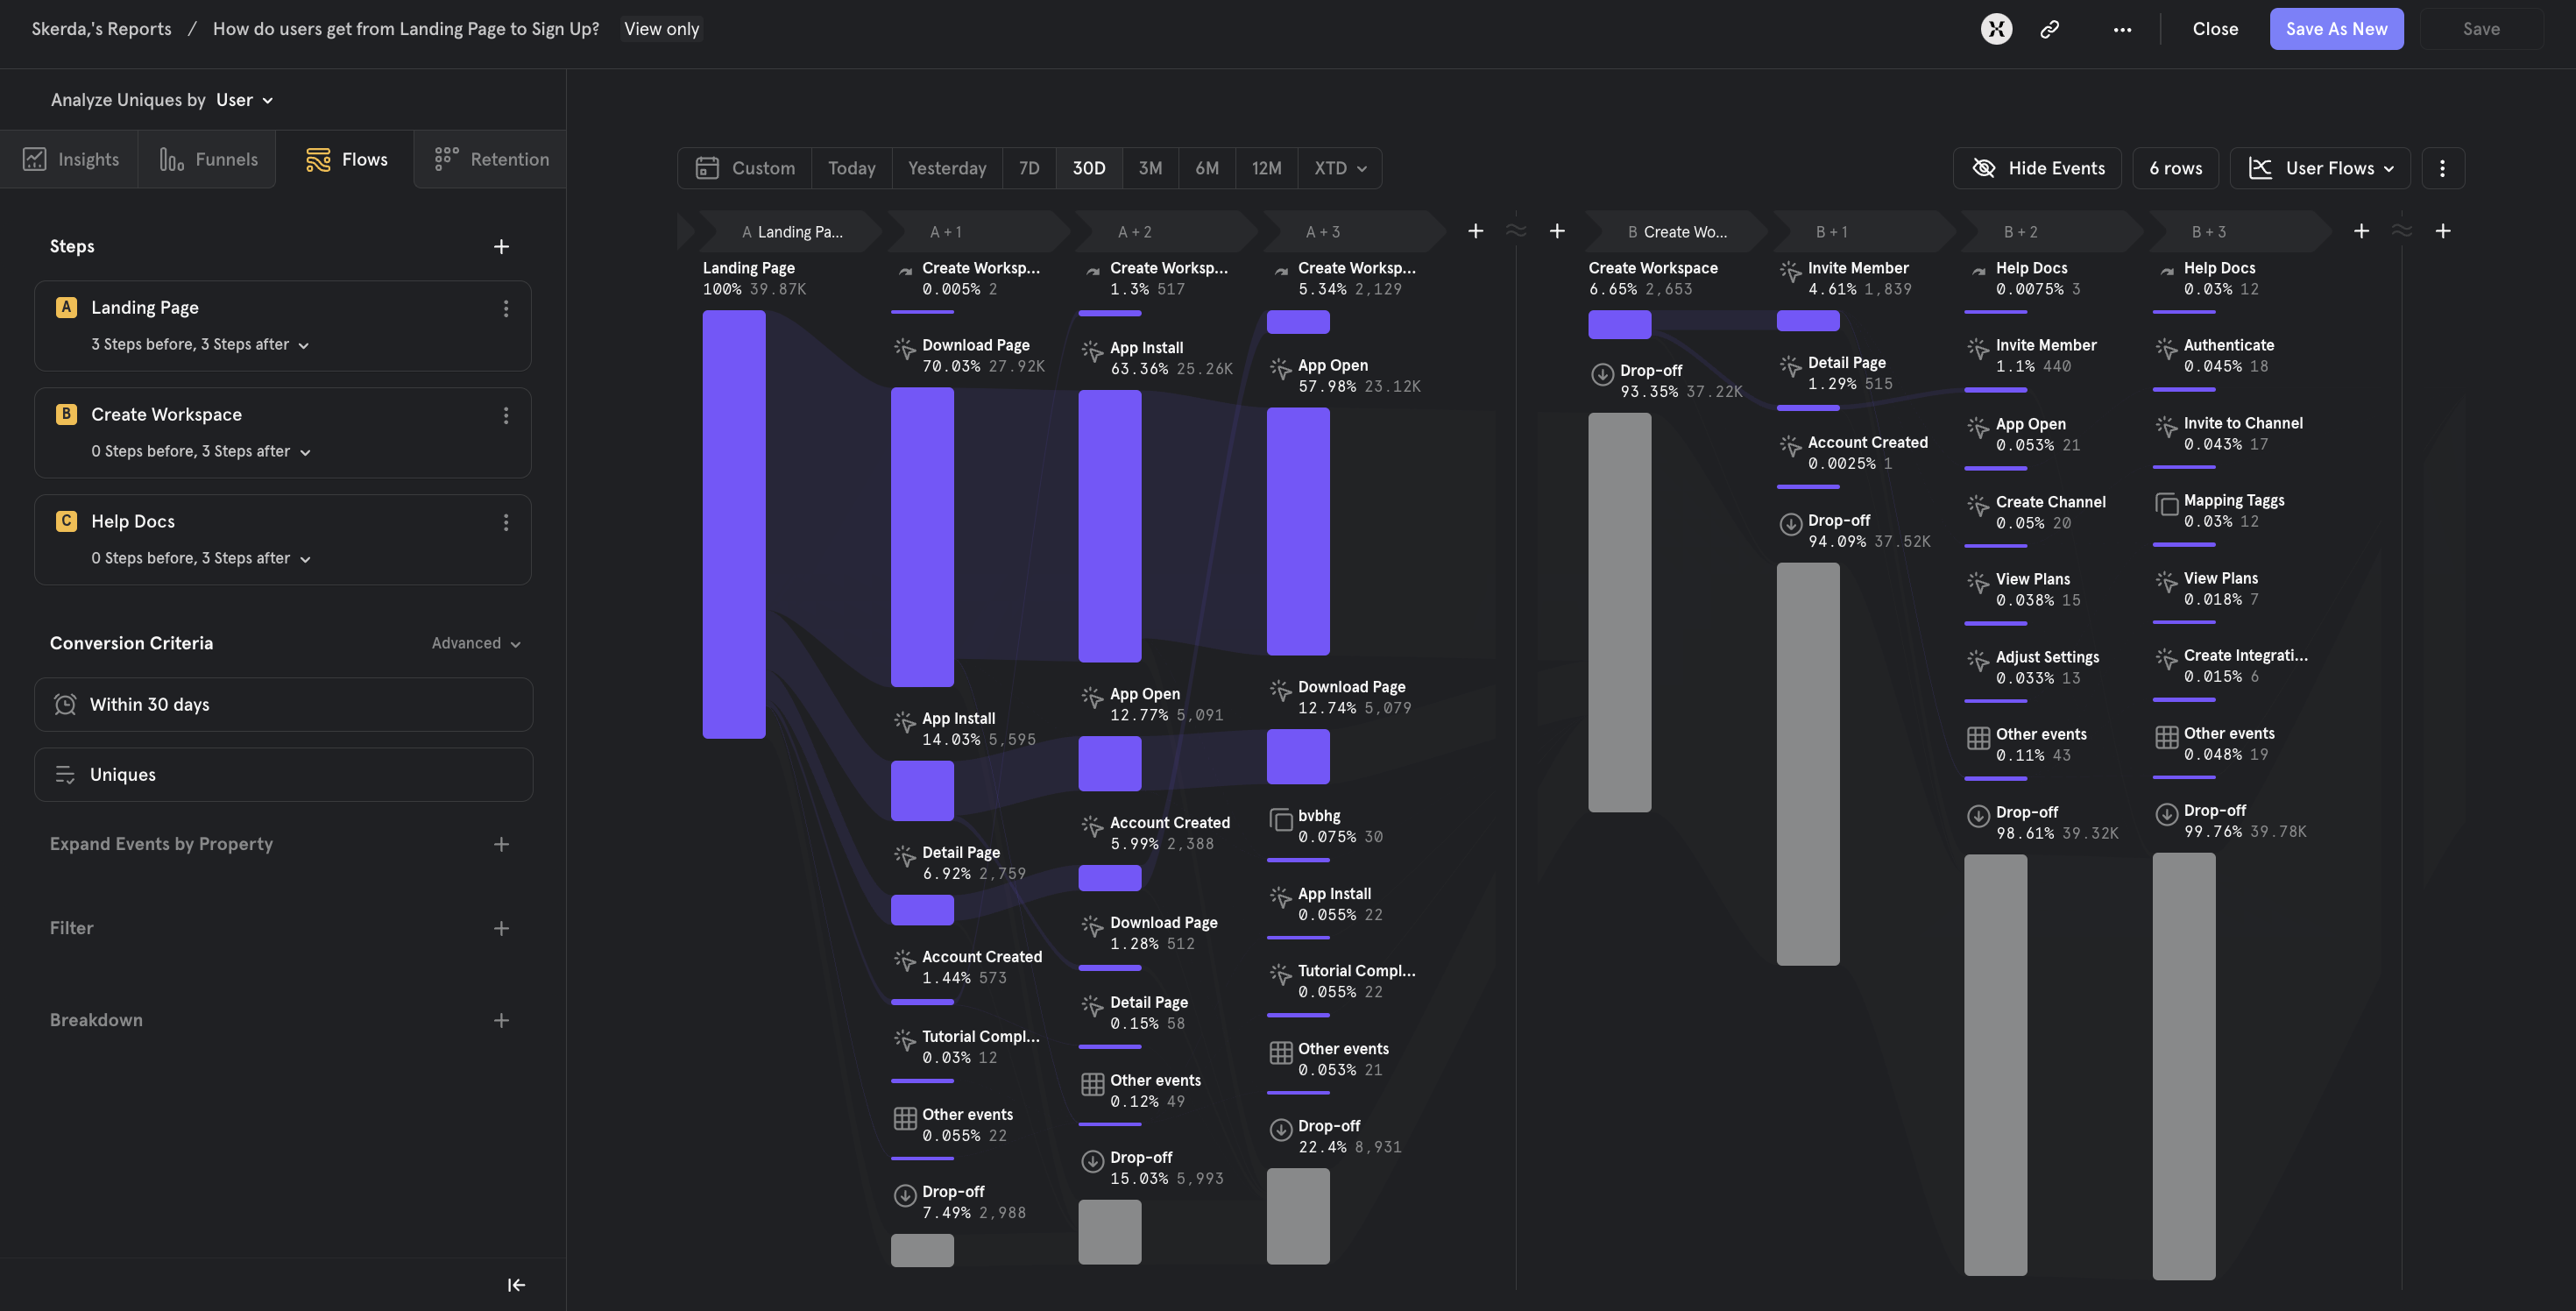
You can also add steps to your flows to see users follow a certain path, and the performance of that path compared to other alternatives.
Mixpanel’s behavioral analytics
Mixpanel has features for behavioral analytics that help product teams and developers understand users’ actions.
Below are features that are accessible for use when analyzing user behavior on Mixpanel:
- Funnels: To track users’ progress toward outcomes such as purchases or signups, Mixpanel’s funnel feature can help you with funnel reports. Funnels display a series of stages in a user journey and how many users progress from one stage to the next—for example, from download to sign up and purchase. If one stage has a low conversion rate, it’s a signal that that stage needs attention.
- A/B test segmentation: Mixpanel’s segmentation helps teams build more complete customer profiles and create cohorts (defined segments of users based on common important characteristics or experiences). Armed with this information, you can adjust your product and marketing to better address the specific needs of each segment or of the business.
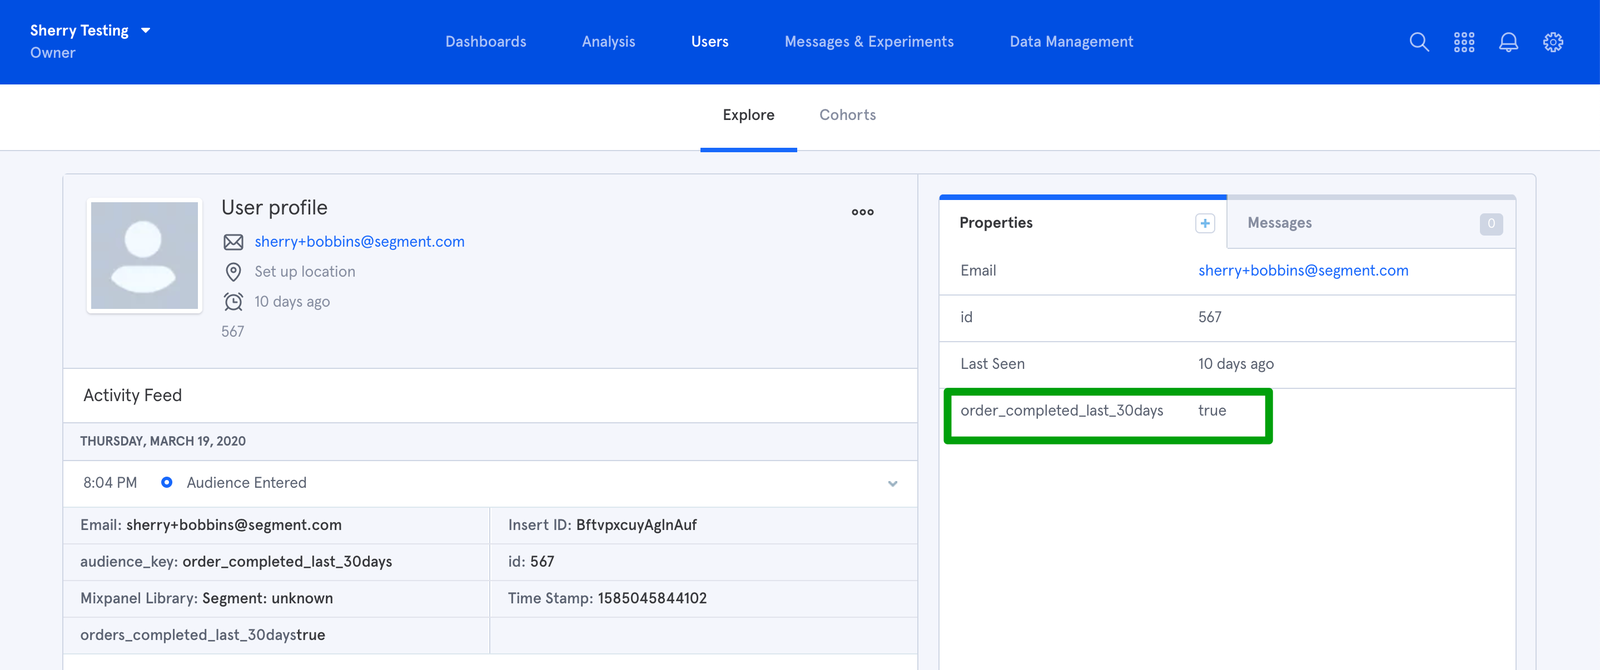
- Data association: Each data point corresponds to a unique user ID, connecting events like sign-ups, cart additions, and interactions.
- Data customization: Mixpanel’s customizable data parameters allow precise user behavior insights, enabling behavioral segmentation for targeted campaigns.
- User activity tracking: Daily, weekly, and monthly active user reports (DAU, WAU, MAU) provide insights into user engagement trends.
- Integration flexibility: Mixpanel seamlessly integrates with tools like Segment, streamlining data sharing. SDKs and an import API further enhance data management.
What are the pros and cons of Mixpanel?
Mixpanel’s pros
Let’s have a look at the pros of using Mixpanel:
- Sophisticated features that enable granular data analysis are a significant advantage of using Mixpanel because they allow you to gain deeper insights into user behavior, interactions, and trends. For example, with the event tracking feature, you can track user sign-ups, product purchases, clicks on specific buttons, and more.
- Unlimited segmentation capabilities: It offers unlimited segmentation capabilities on attributes, user properties, and cohorts. This level of segmentation gives you a more detailed view of your consumers and their engagement level.
- Easy-to-navigate UI patterns: The user interface of this platform is simple and has a wide variety of functions and resources to help you work in the most organized way, have better team coordination, and keep efficiency high.
- Seamless onboarding for your product team: Getting started on Mixpanel is easy and without stress. Register, choose a plan, or hop on for a free trial.
- A free plan that is sufficient for small SaaS companies: This free plan offers valuable features and resources — unlimited integrations, unlimited collaborators, templates, and essentials to get started quickly — that can help you gain insights into user behavior and make data-driven decisions, even when operating with limited budgets.
- Powerful interactive and easily accessible visuals: For quicker decision-making to beat analysis paralysis.
Mixpanel’s cons
While Mixpanel is a powerful product analytics tool with many great features, there are still some downsides. Here are the main cons of the tool:
- The free plan works well for small SaaS businesses, but enterprise-grade features can be expensive depending on your needs.
- You will need the help of your engineering team to set up and configure the tool — The platform’s advanced functionalities, custom event tracking and segmentation, might require a steeper learning curve, especially for those without a strong background in data analysis.
- Limited Attribution Models: While Mixpanel offers various analytics features, its attribution modeling capabilities might be more limited.
- There is no user feedback or engagement functionality, so you need third-party tools.
![]()
Looking for a Better Alternative for User Analytics? Try Userpilot!
What do users say about Mixpanel?
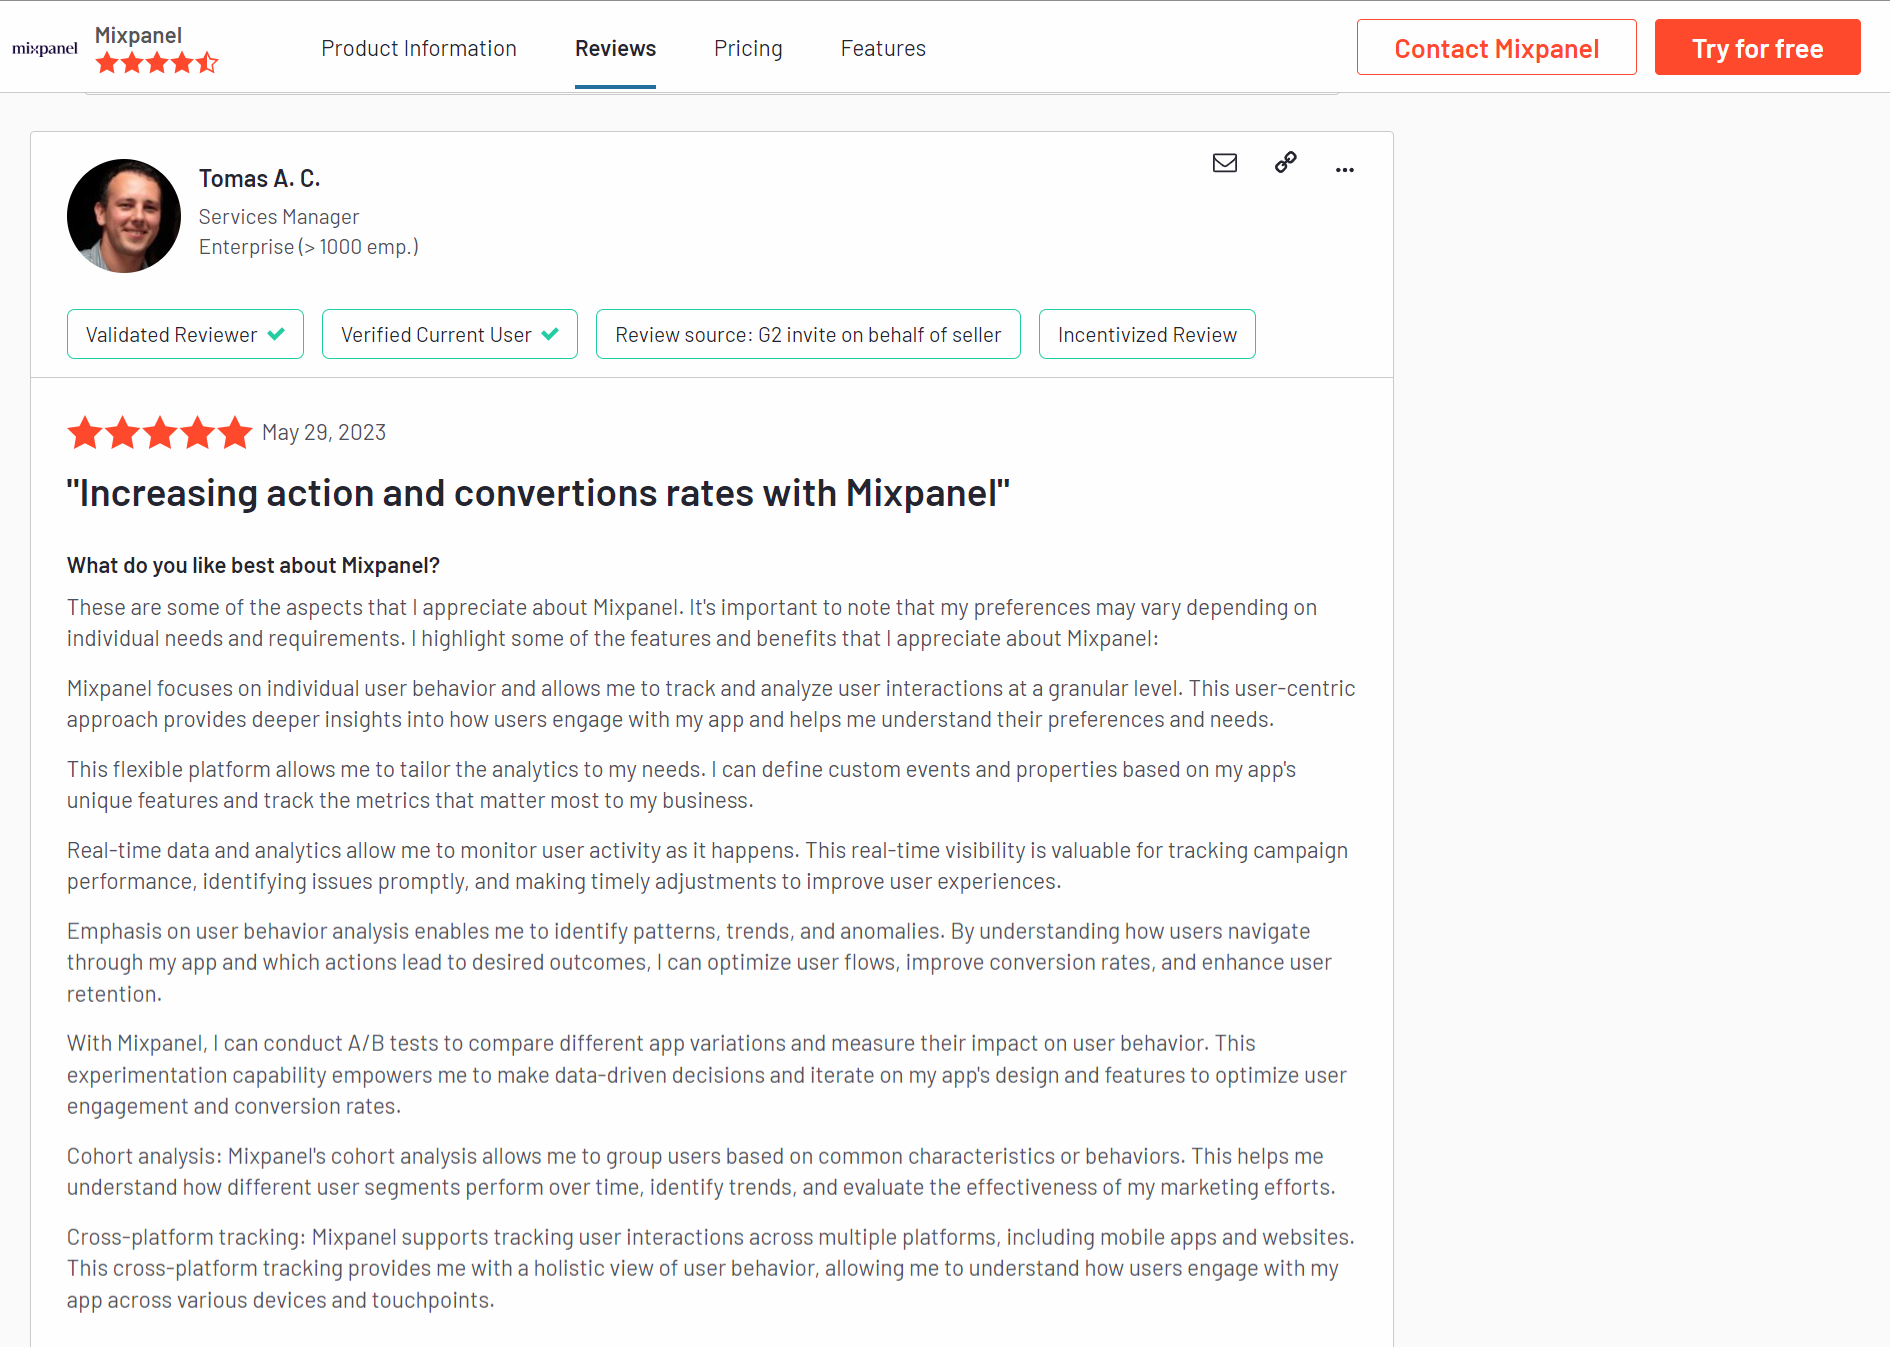
Mixpanel is consistently termed an excellent, powerful, and result-oriented tool by its loyal customers. Generally, customers say it’s easy to use, easy to customize, and how easily it tracks analytics.
Here are the great stories customers are telling about Mixpanel:
These are some of the aspects that I appreciate about Mixpanel. It’s important to note that my preferences may vary depending on individual needs and requirements. I highlight some of the features and benefits that I appreciate about Mixpanel: Mixpanel focuses on individual user behavior and allows me to track and analyze user interactions at a granular level. This user-centric approach provides deeper insights into how users engage with my app and helps me understand their preferences and needs. This flexible platform allows me to tailor the analytics to my needs. I can define custom events and properties based on my app’s unique features and track the metrics that matter most to my business…
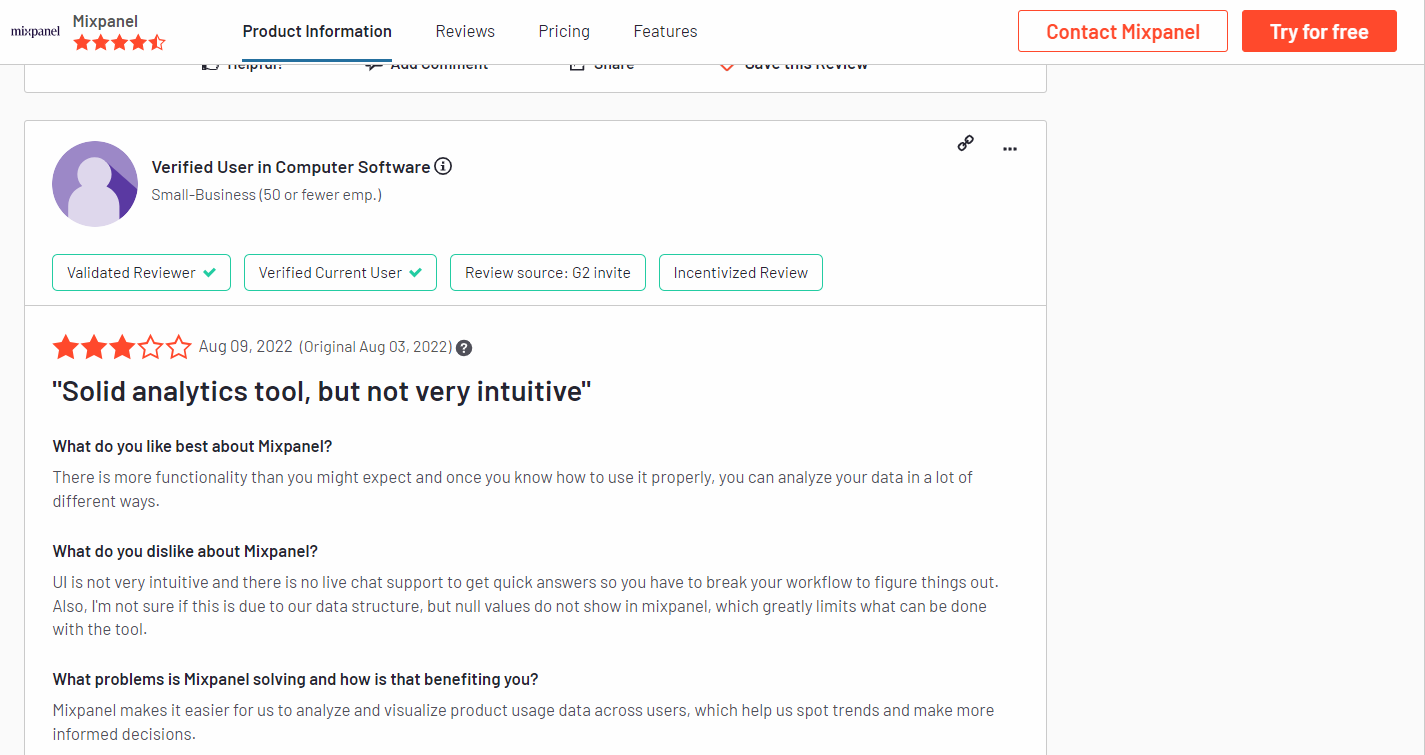
 While Mixpanel has some great reviews, there are still some little downsides and quirks (same as every other SaaS tool). Here are some bad reviews of Mixpanel:
UI is not very intuitive and there is no live chat support to get quick answers so you have to break your workflow to figure things out. Also, I’m not sure if this is due to our data structure, but null values do not show in mixpanel, which greatly limits what can be done with the tool.
Mixpanel’s pricing
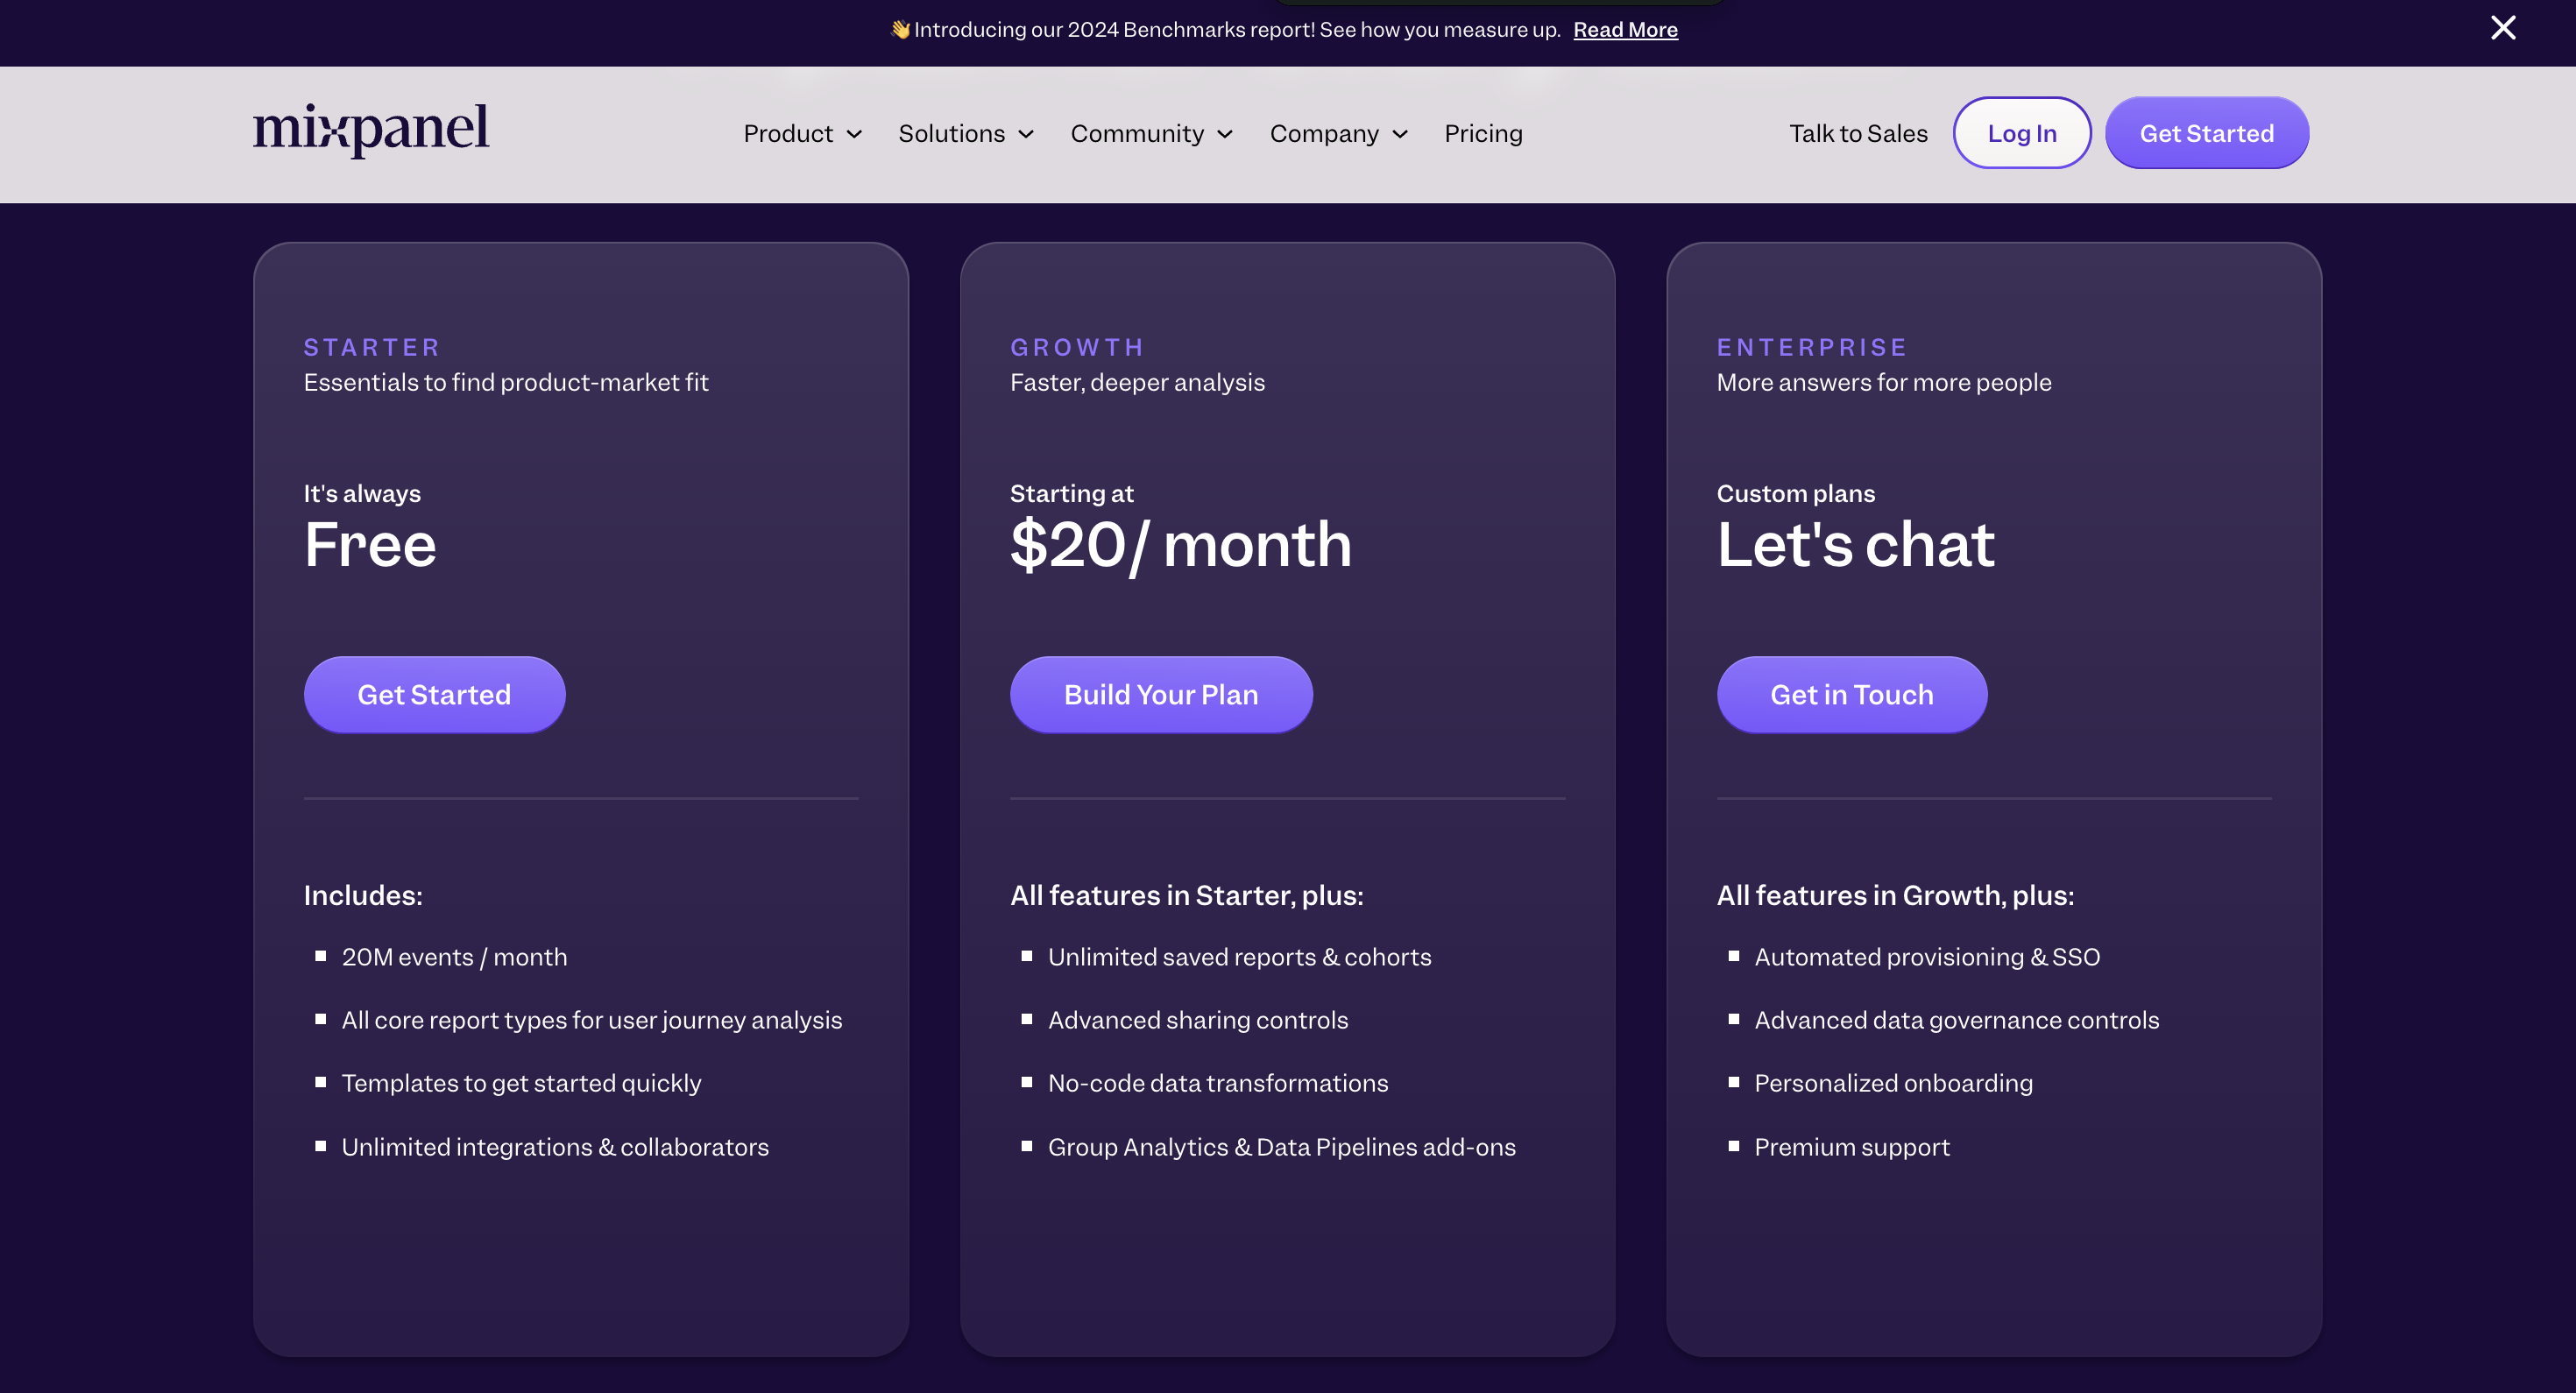
Mixpanel’s pricing plan is divided into 3 plans; the starter plan, the enterprise plan, and the growth plan.
Here’s an overview of the pricing plans and features of each plan:
- Starter plan: This plan features essentials to find product-market fit. It is free and allows up to 20M monthly events. In addition, you get access to all core reports for user journey analysis, templates to get started easily, unlimited integrations, and unlimited collaborators.
- Growth plan: This plan costs $20 per month for up to 100M monthly events. You get all features in the starter plan plus unlimited saved reports to monitor, update & iterate on KPIs, Mixpanel modeling layer, and group analytics & data pipeline add-ons.
- Enterprise plan: This plan empowers your team, especially if you have a large organization. You’ll have to contact their sales representatives for the cost. This plan features all the benefits of the growth plan plus advanced access controls, shared data views for collaboration, automated provisioning & SSO, and prioritized support.
3 Reasons why you might need a Mixpanel alternative
Let’s look at the most common scenarios where Mixpanel is NOT the right tool for your user onboarding needs and you should be looking into using a different one:
- You need better customer support: Mixpanel has been criticized for its poor customer service. You can have a hard time getting the software problems fixed quickly since you might rarely get an instant response from the support team.
- You want behavior-driven product tours: you are seeking to guide users through their product’s features using behavior-driven triggers, a solution like Userpilot is more appropriate.
- You want advanced segmentation: You can create targeted user segments based on specific parameters such as pricing plans, company, location, required actions, NPS score, and more on Userpilot.
Userpilot – A better alternative for user analytics
 User analytics lets you track and analyze the behavior of users within your product. Userpilot lets you filter through customers from a unified dashboard, extract insights from specific segments or time periods, and create custom segments for all users who meet certain conditions. Here’s an overview of Userpilot’s analytics features:
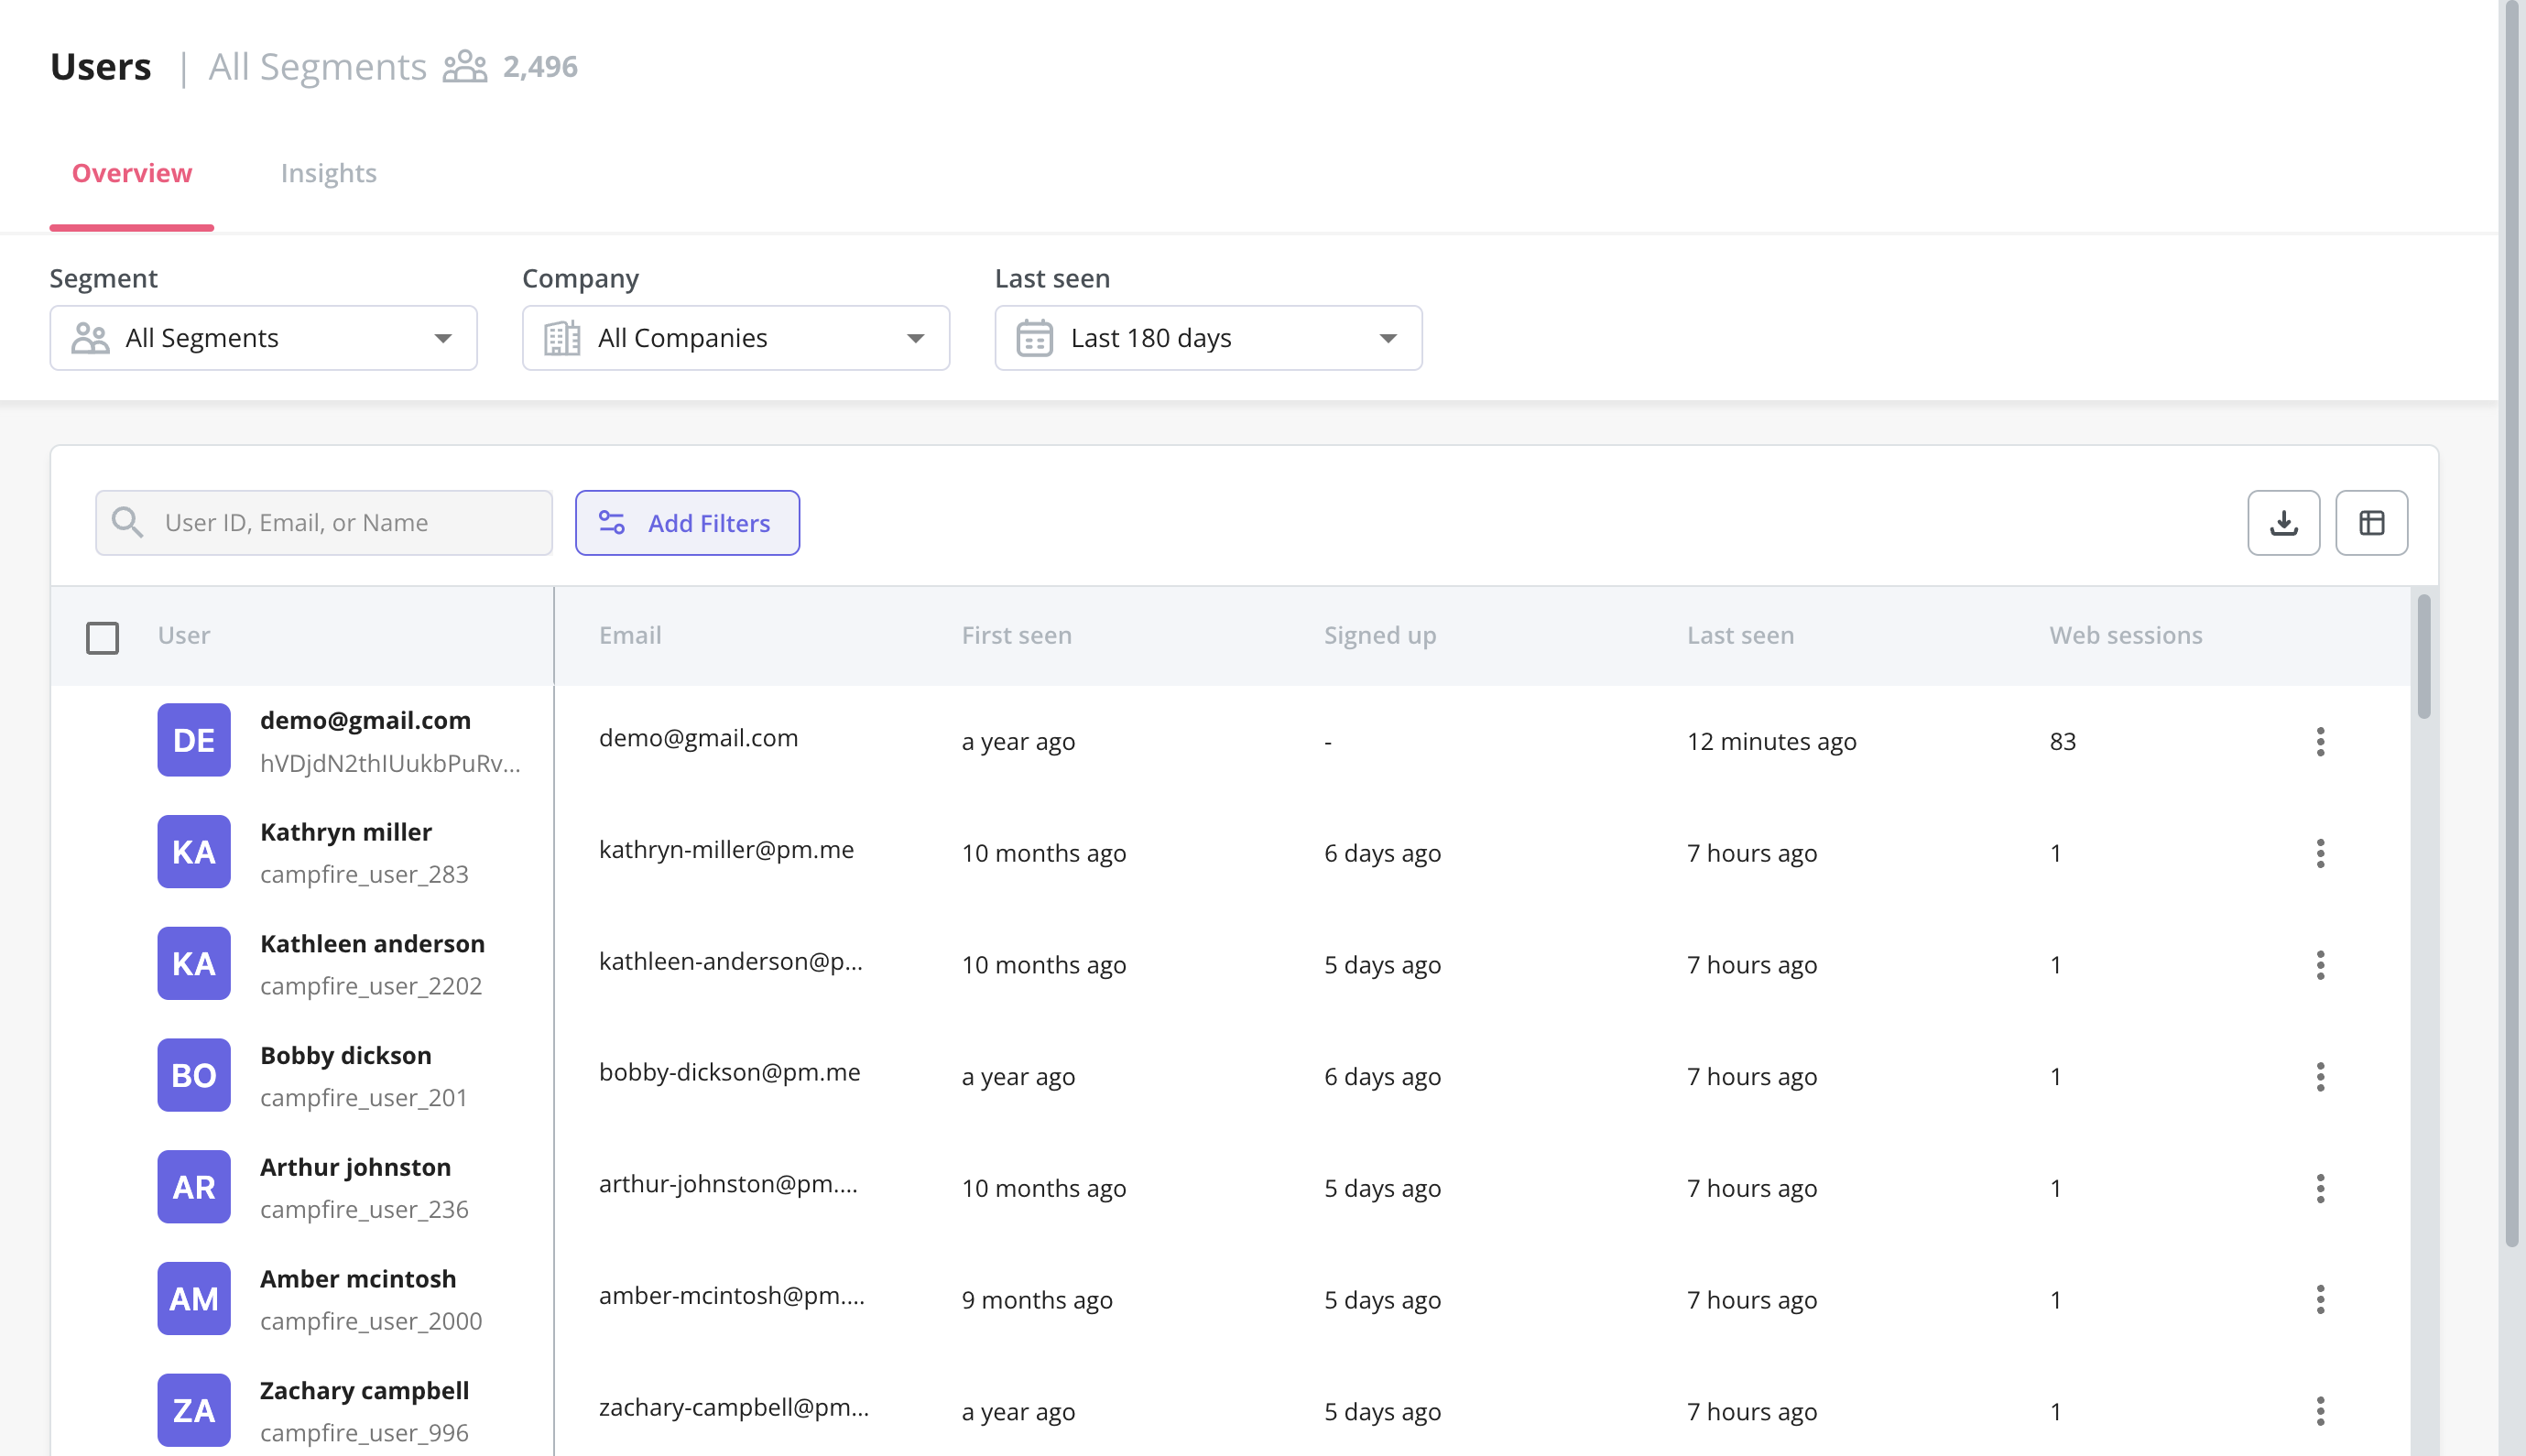
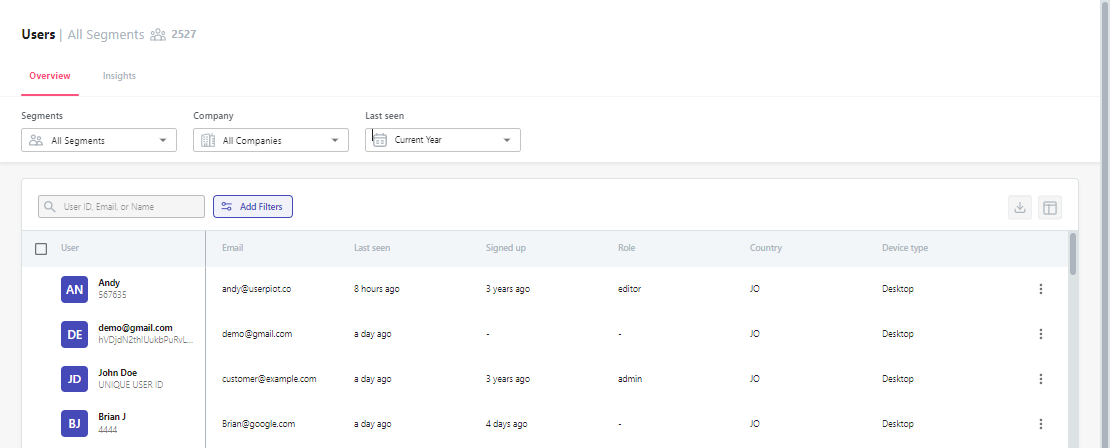
- Users dashboard: Userpilot’s users dashboard gives you an overview of all user data in one place. You’ll be able to filter by segments, which companies users are from, or when they were last seen active. You can also export data in bulk as a CSV or perform actions on individual users.
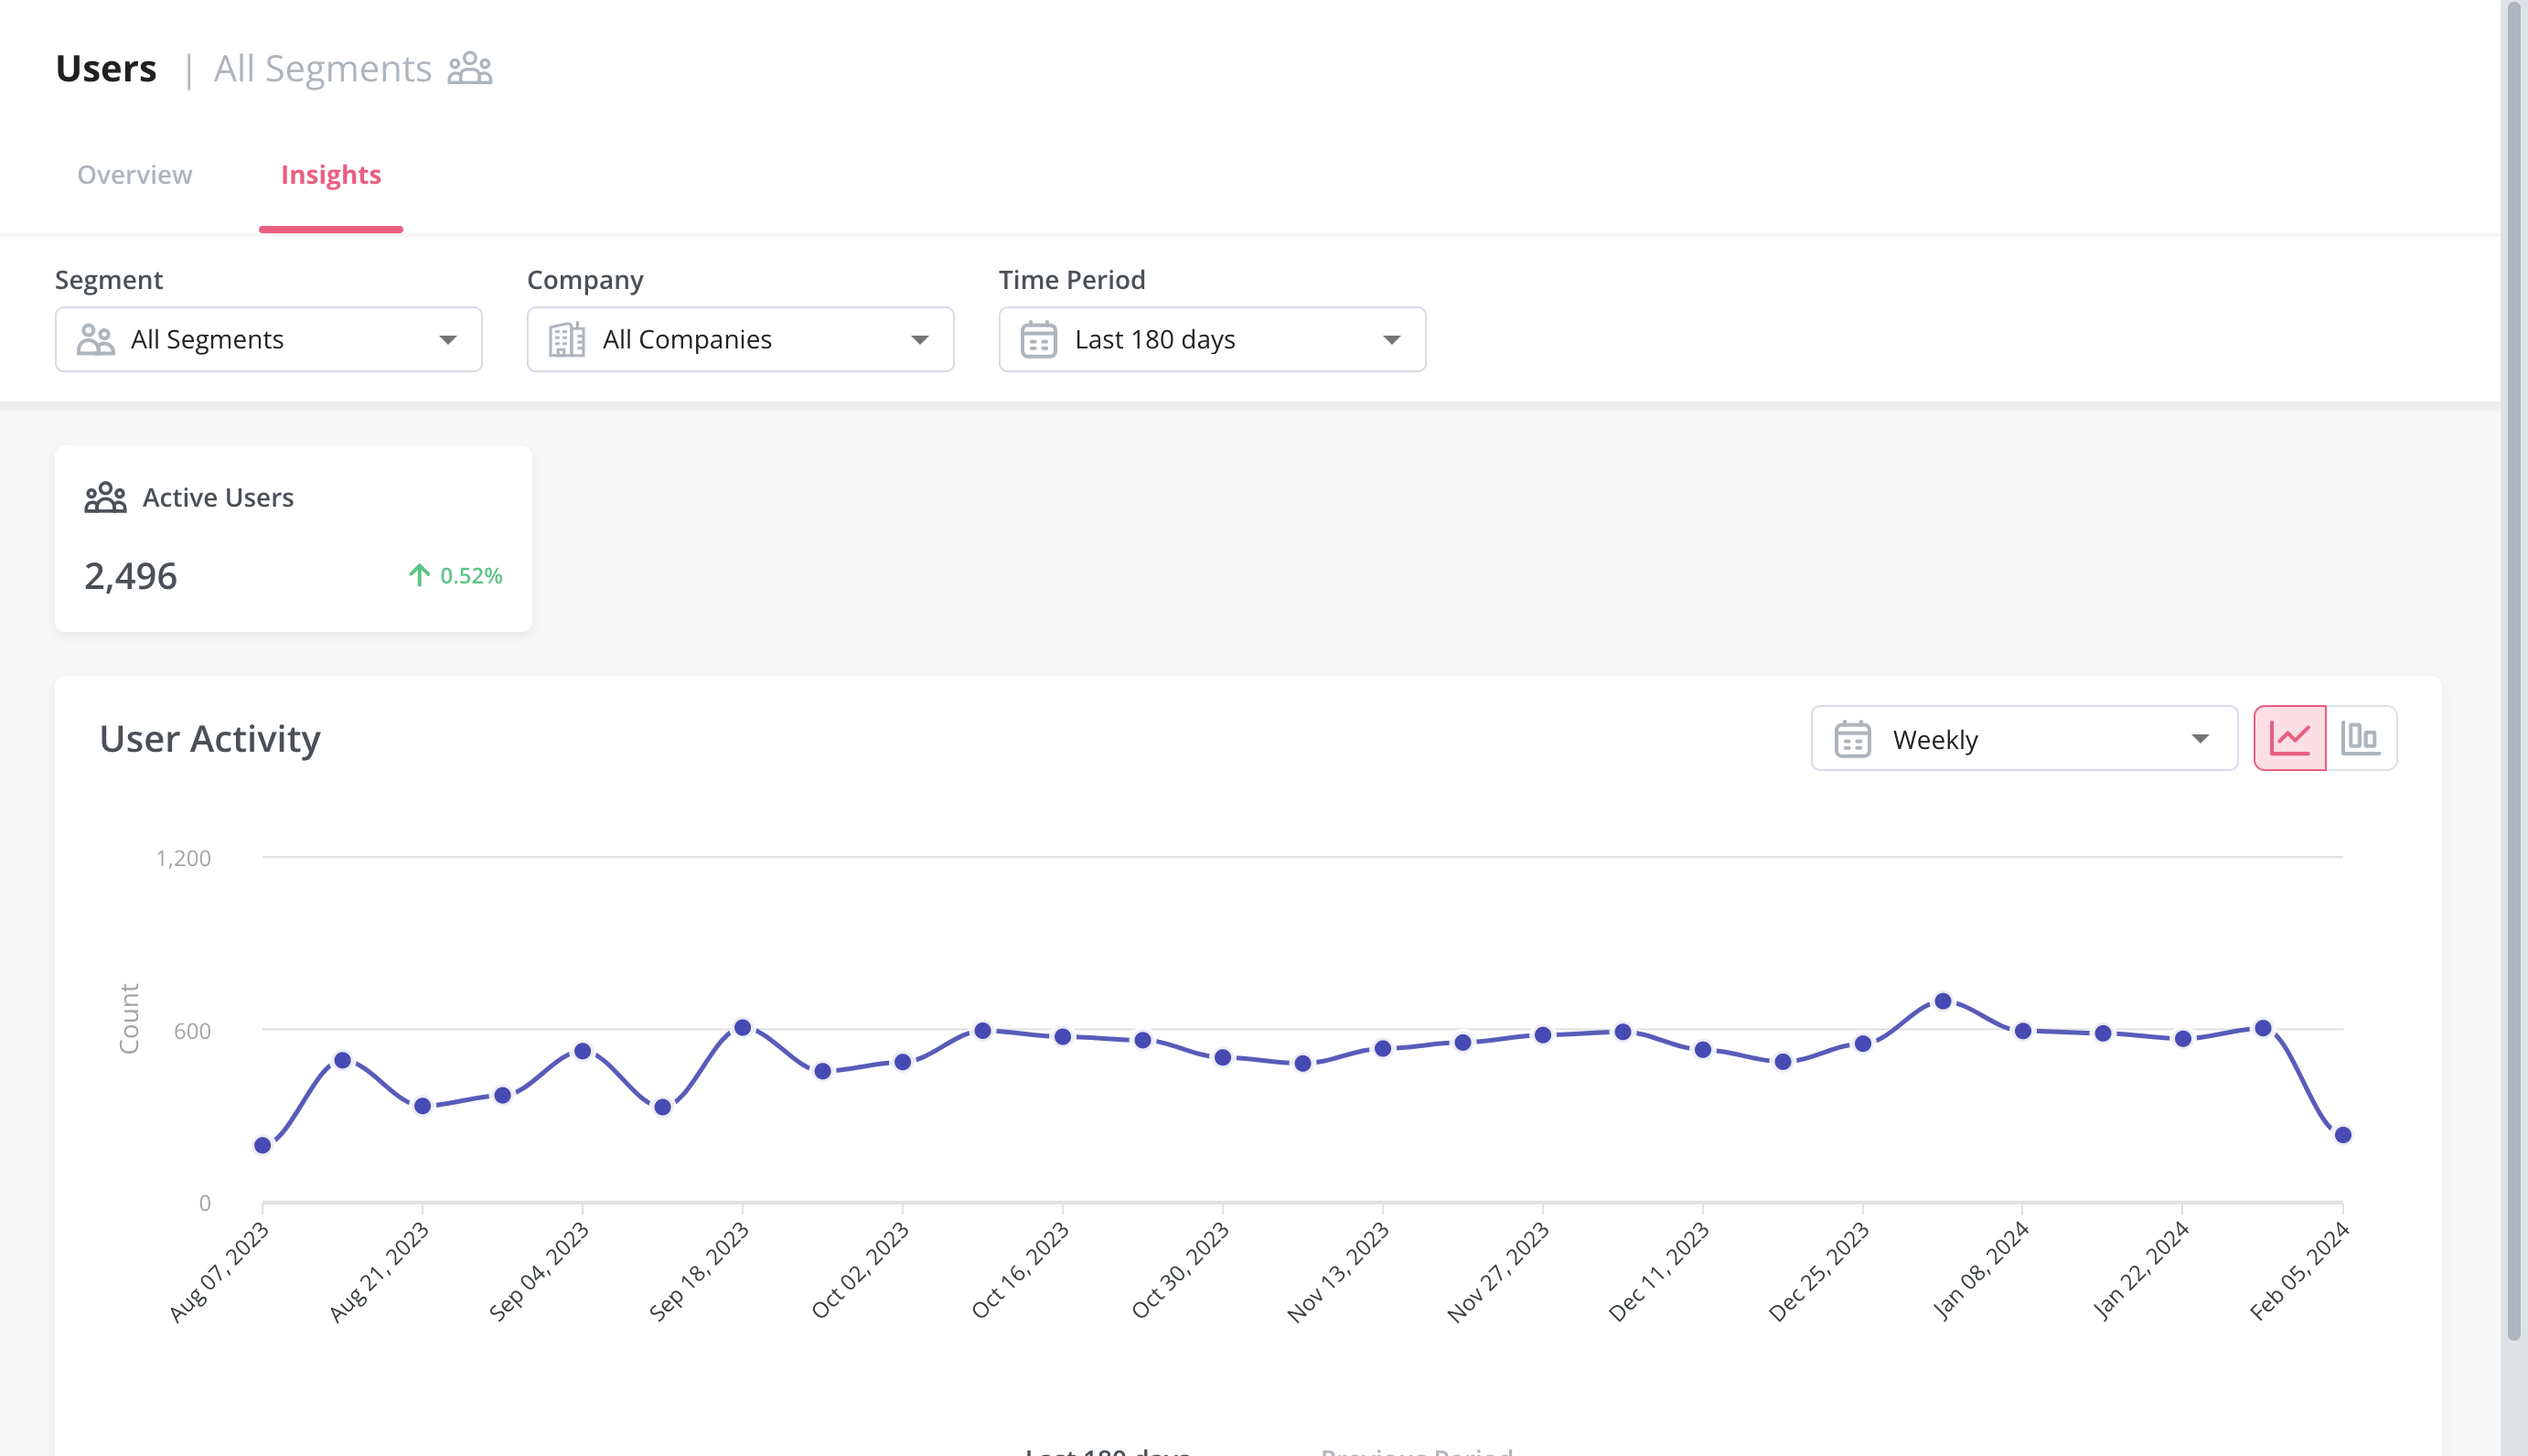
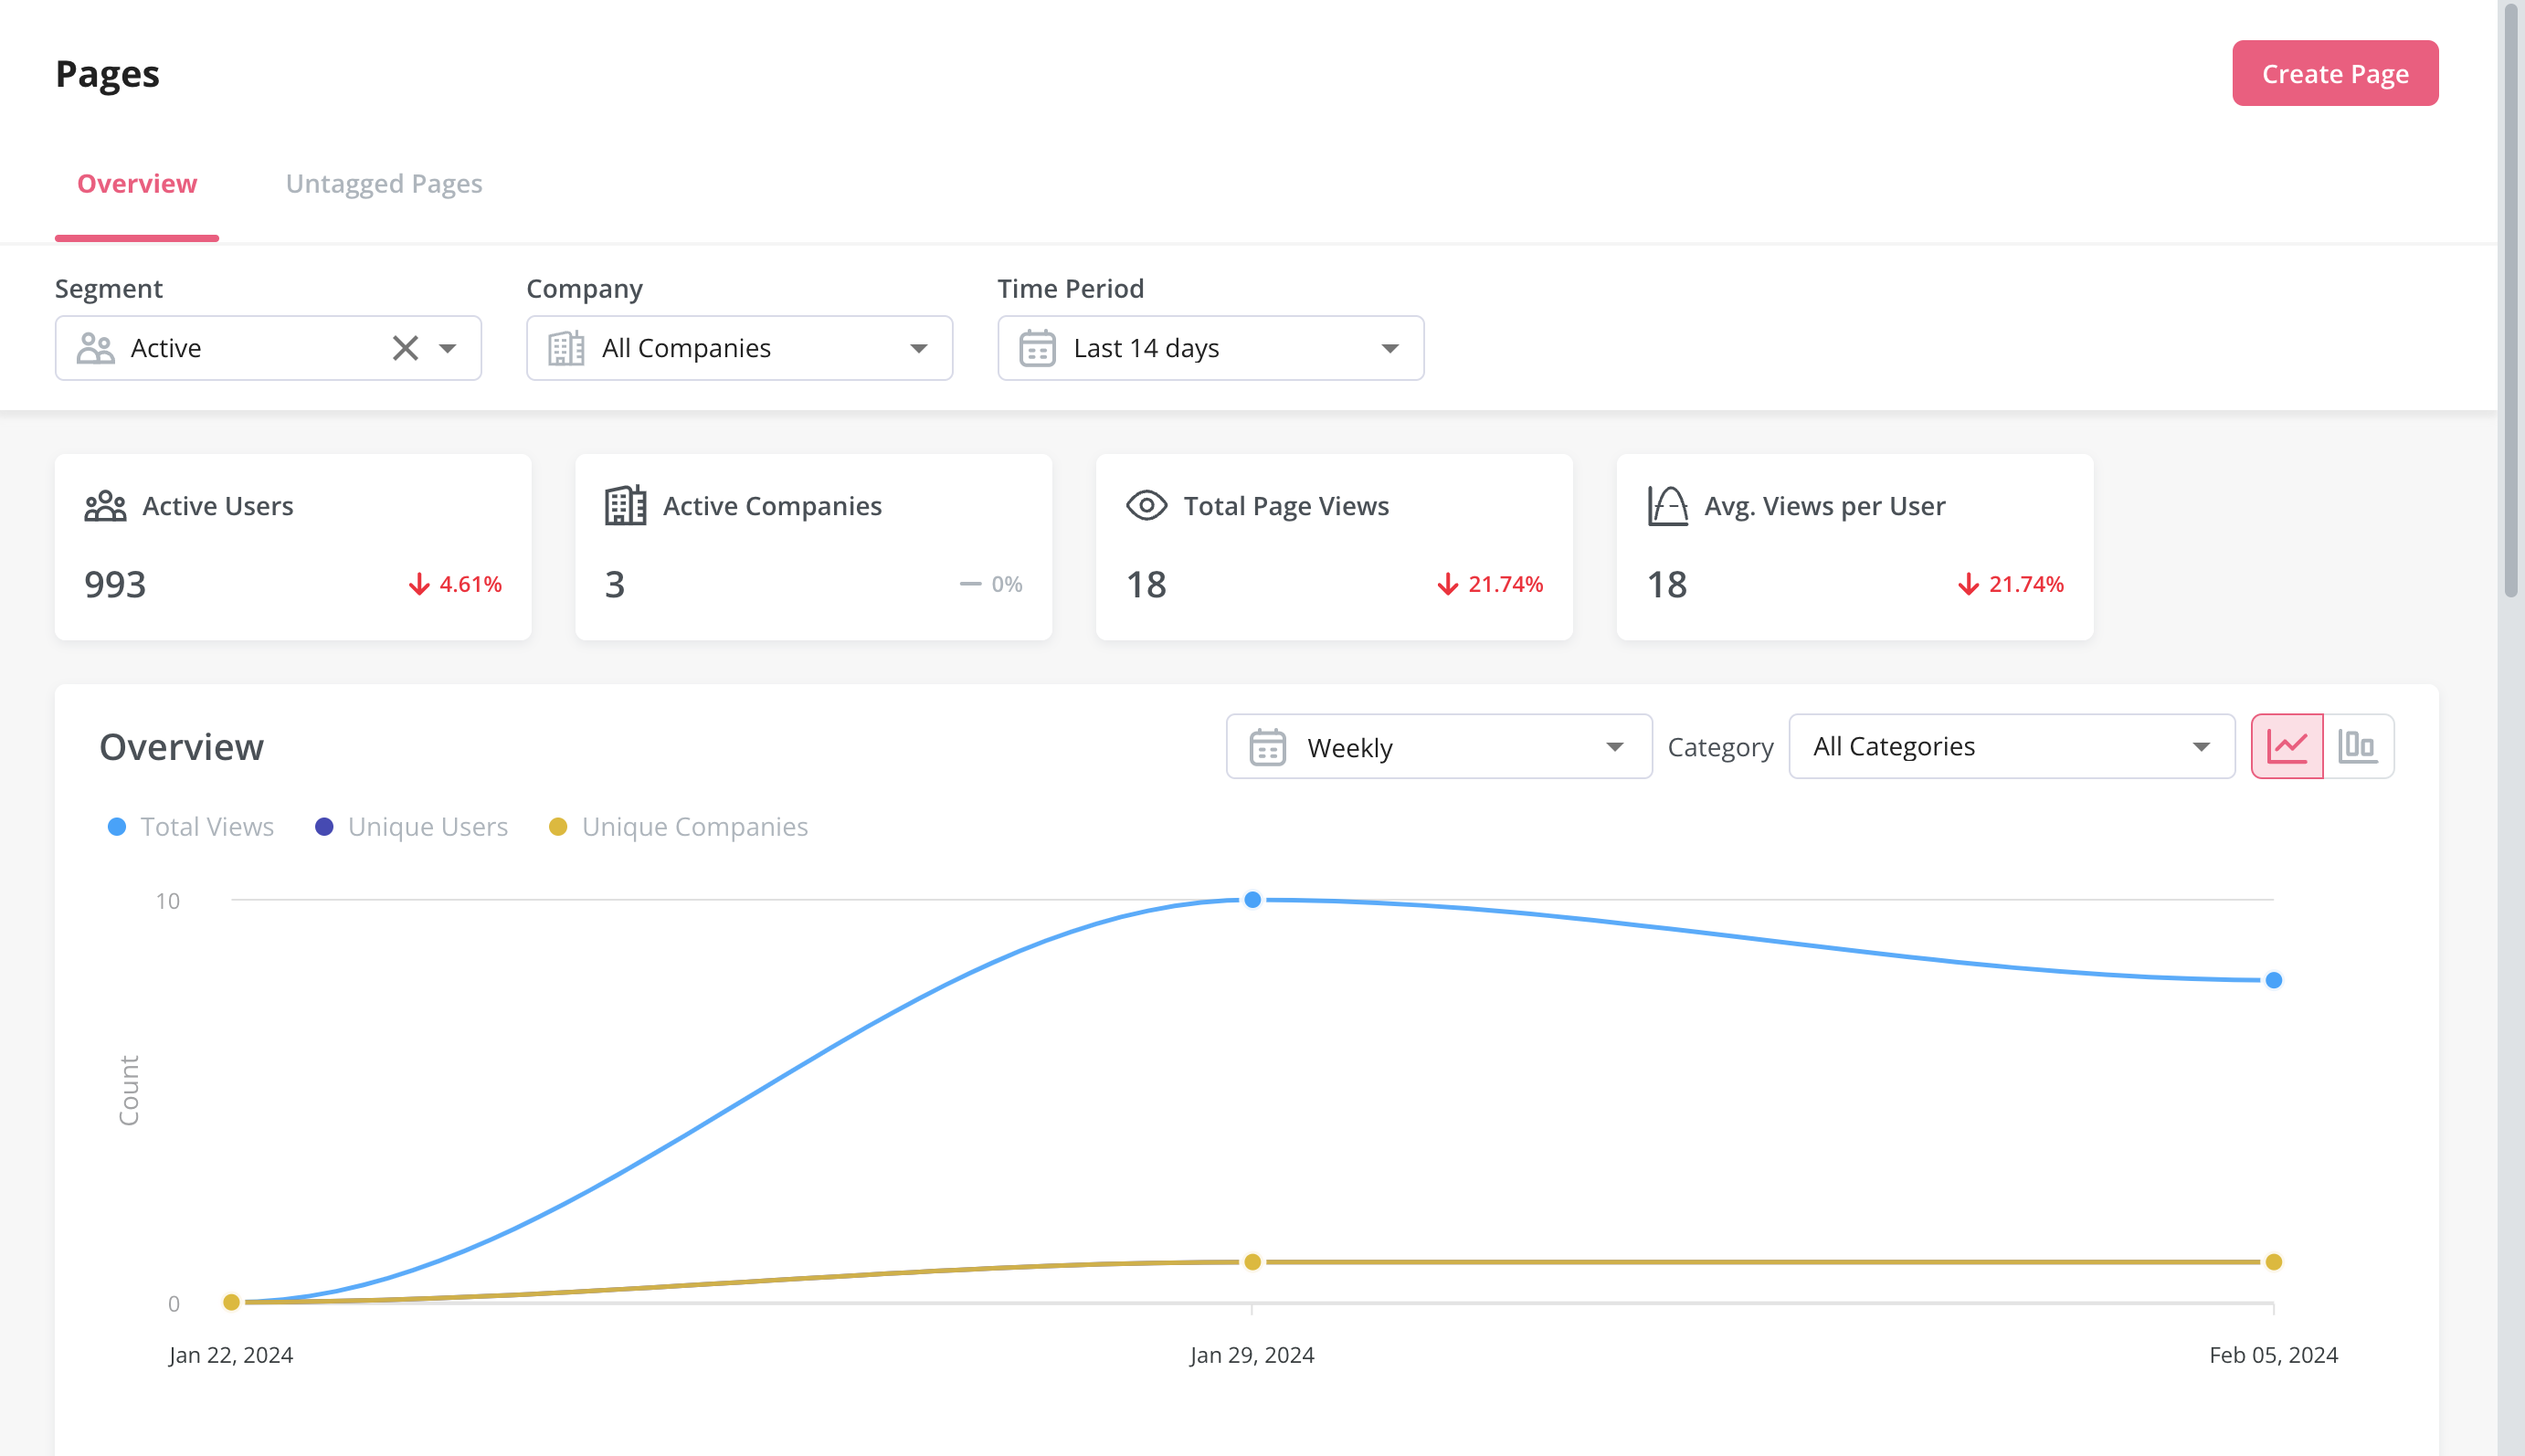
- Audience insights: Much like the overview dashboard, the Insights section lets you filter metrics by segment, company, and time period. You’ll be able to choose between a daily, weekly, or monthly view and then compare data between the current and previous time periods.
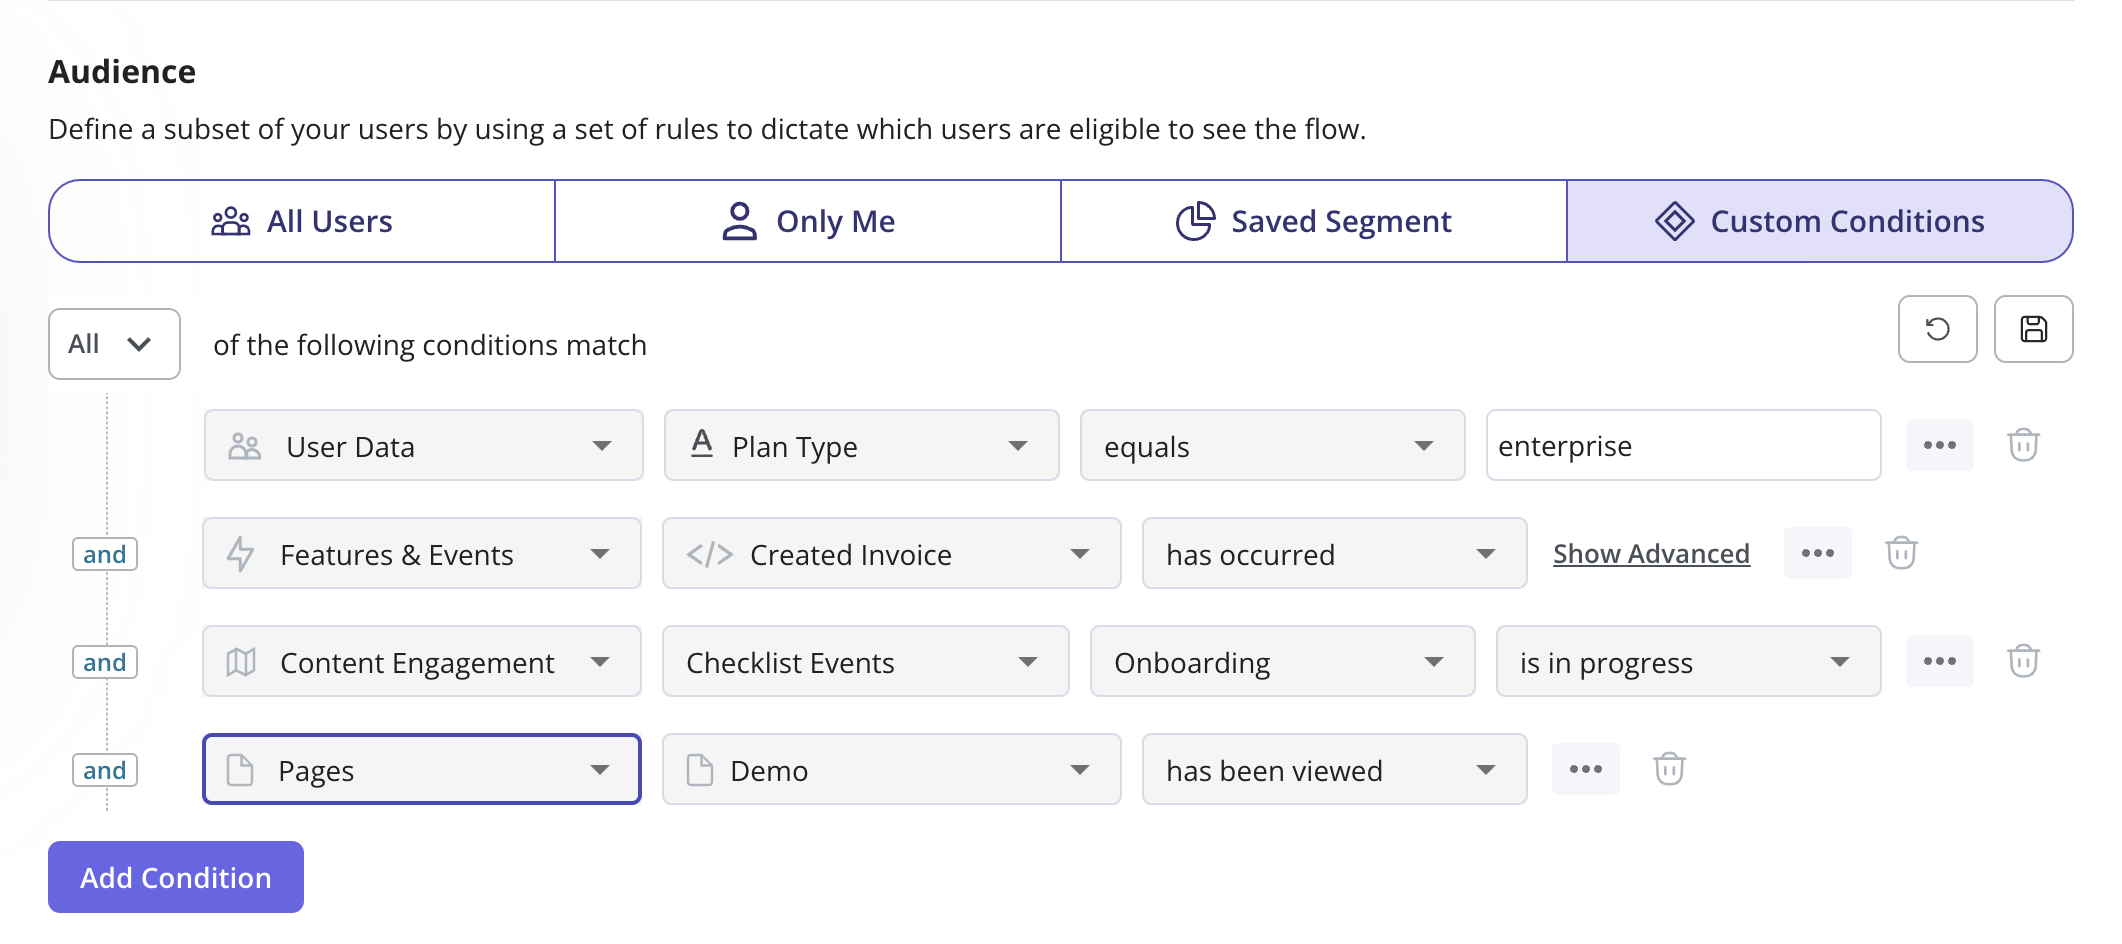
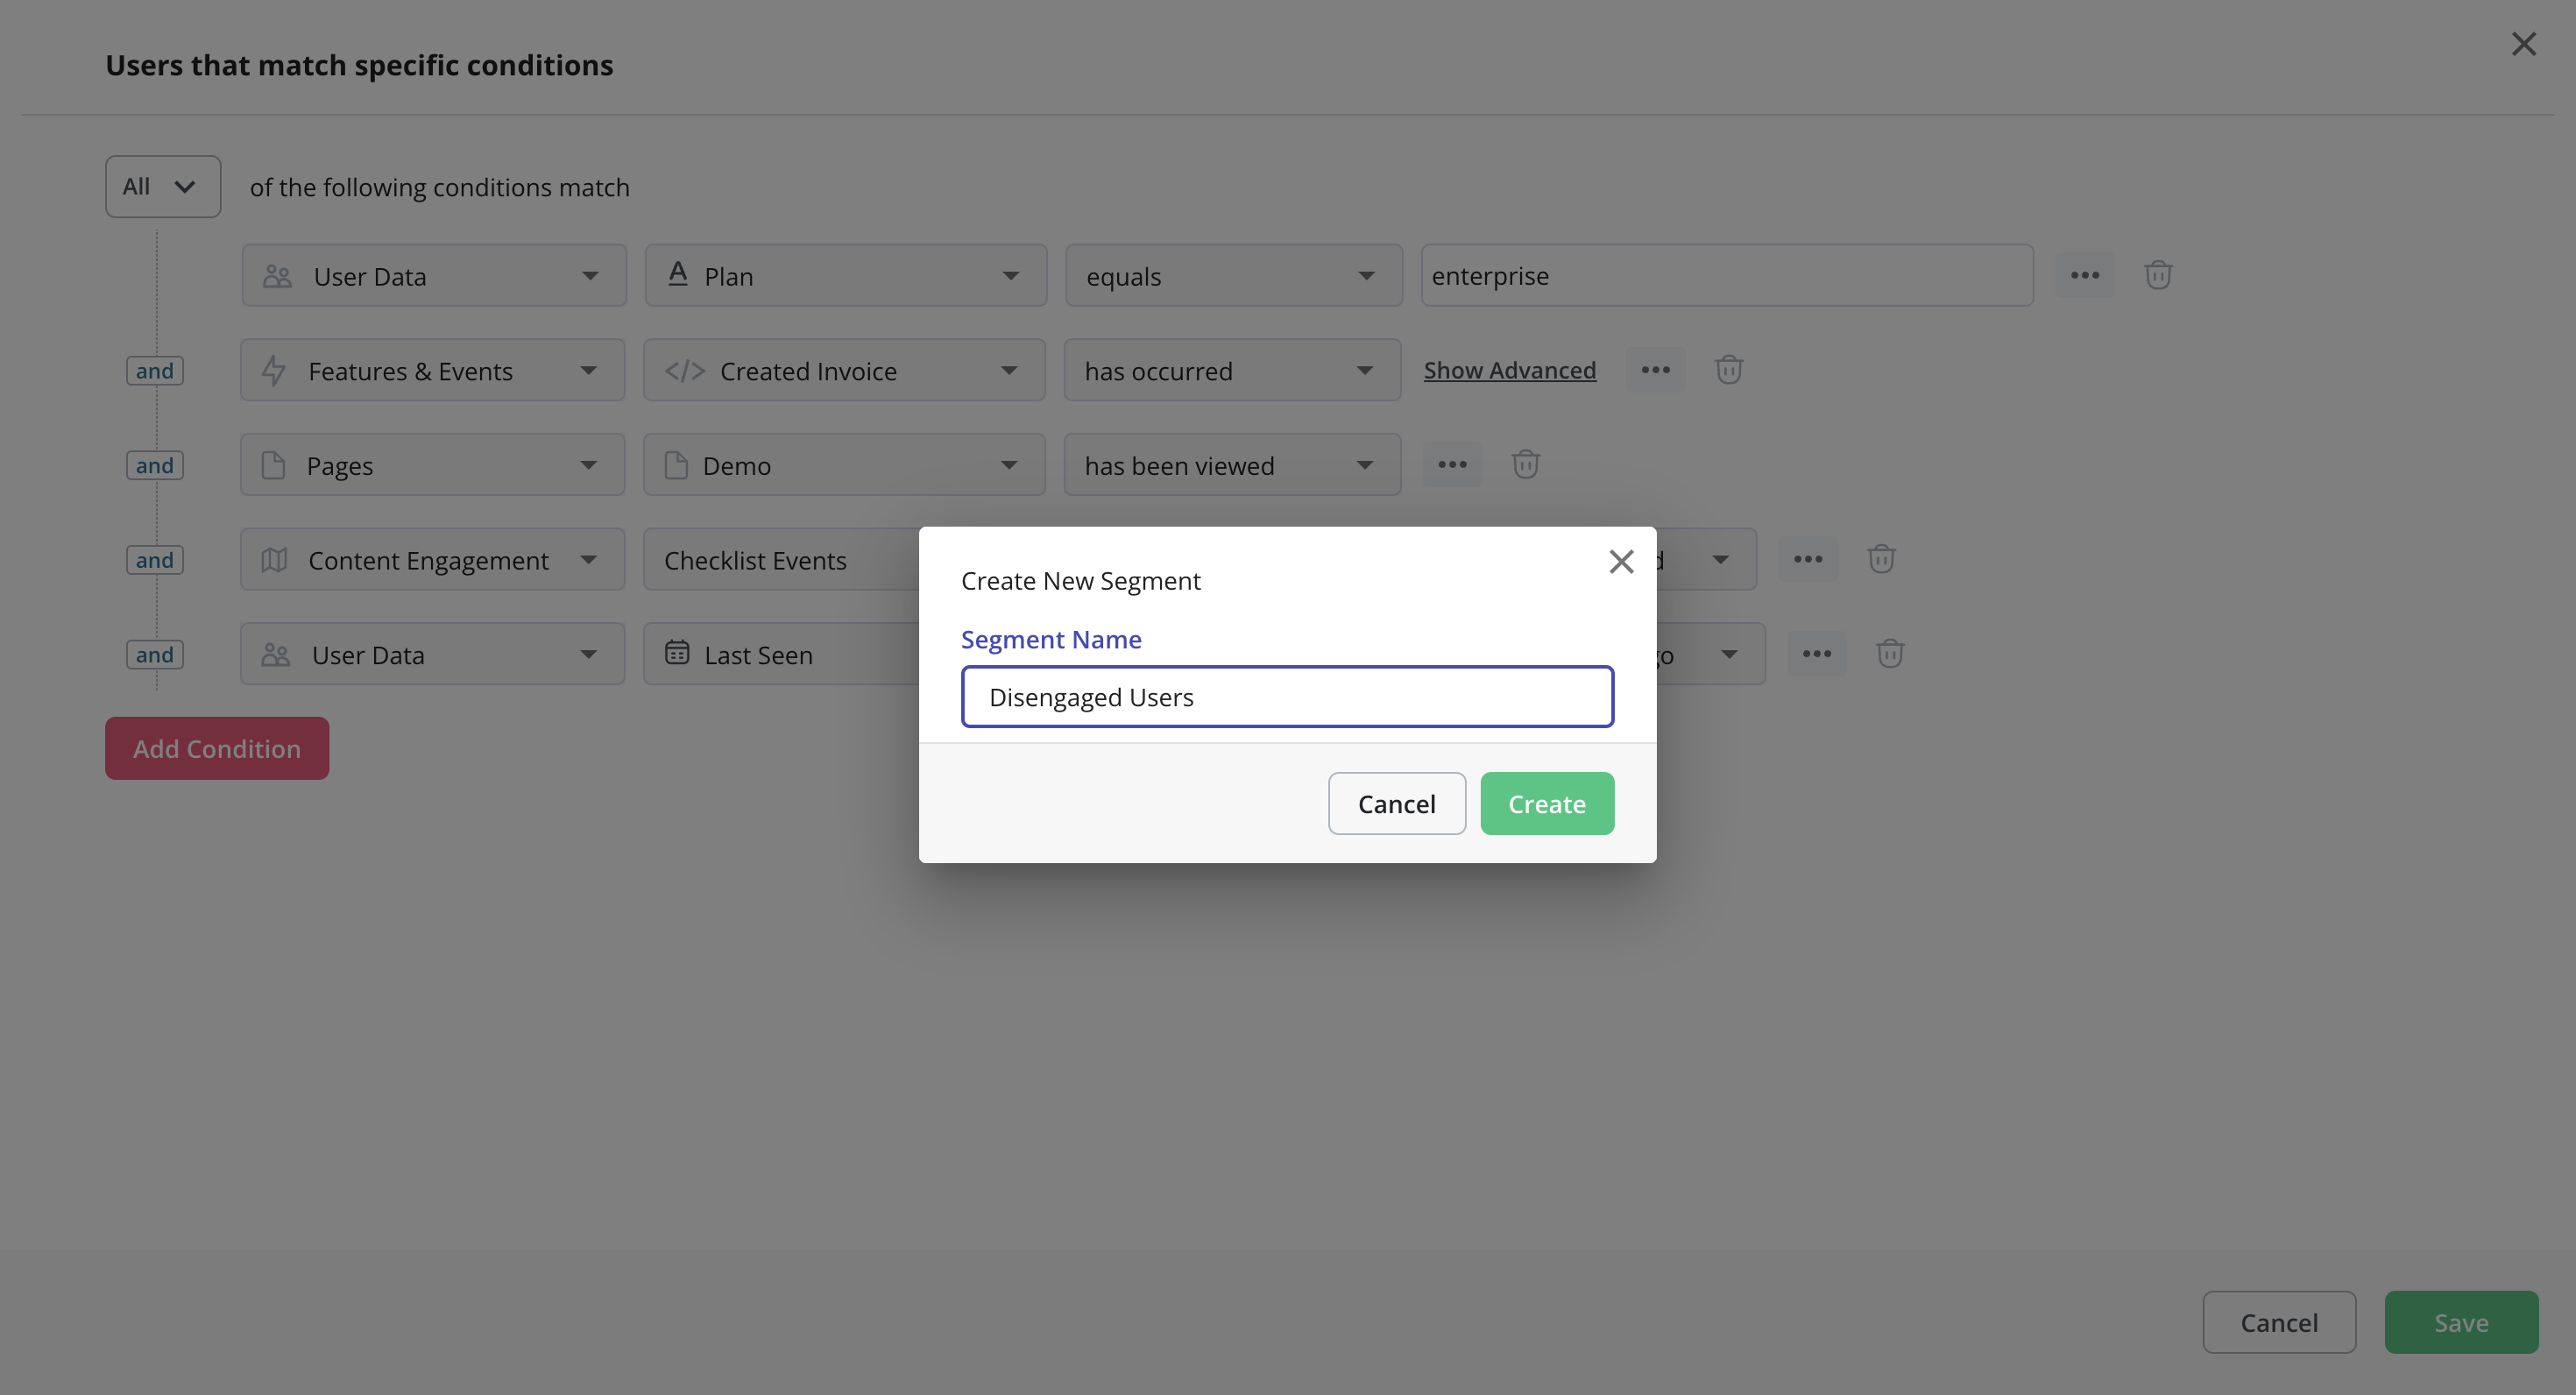
- Conditional segmentation: Practical use cases for user analytics include creating segments for all users that meet certain conditions. For instance, you could reach out to companies in a certain country when creating a new flow or target customers who have tried certain features.
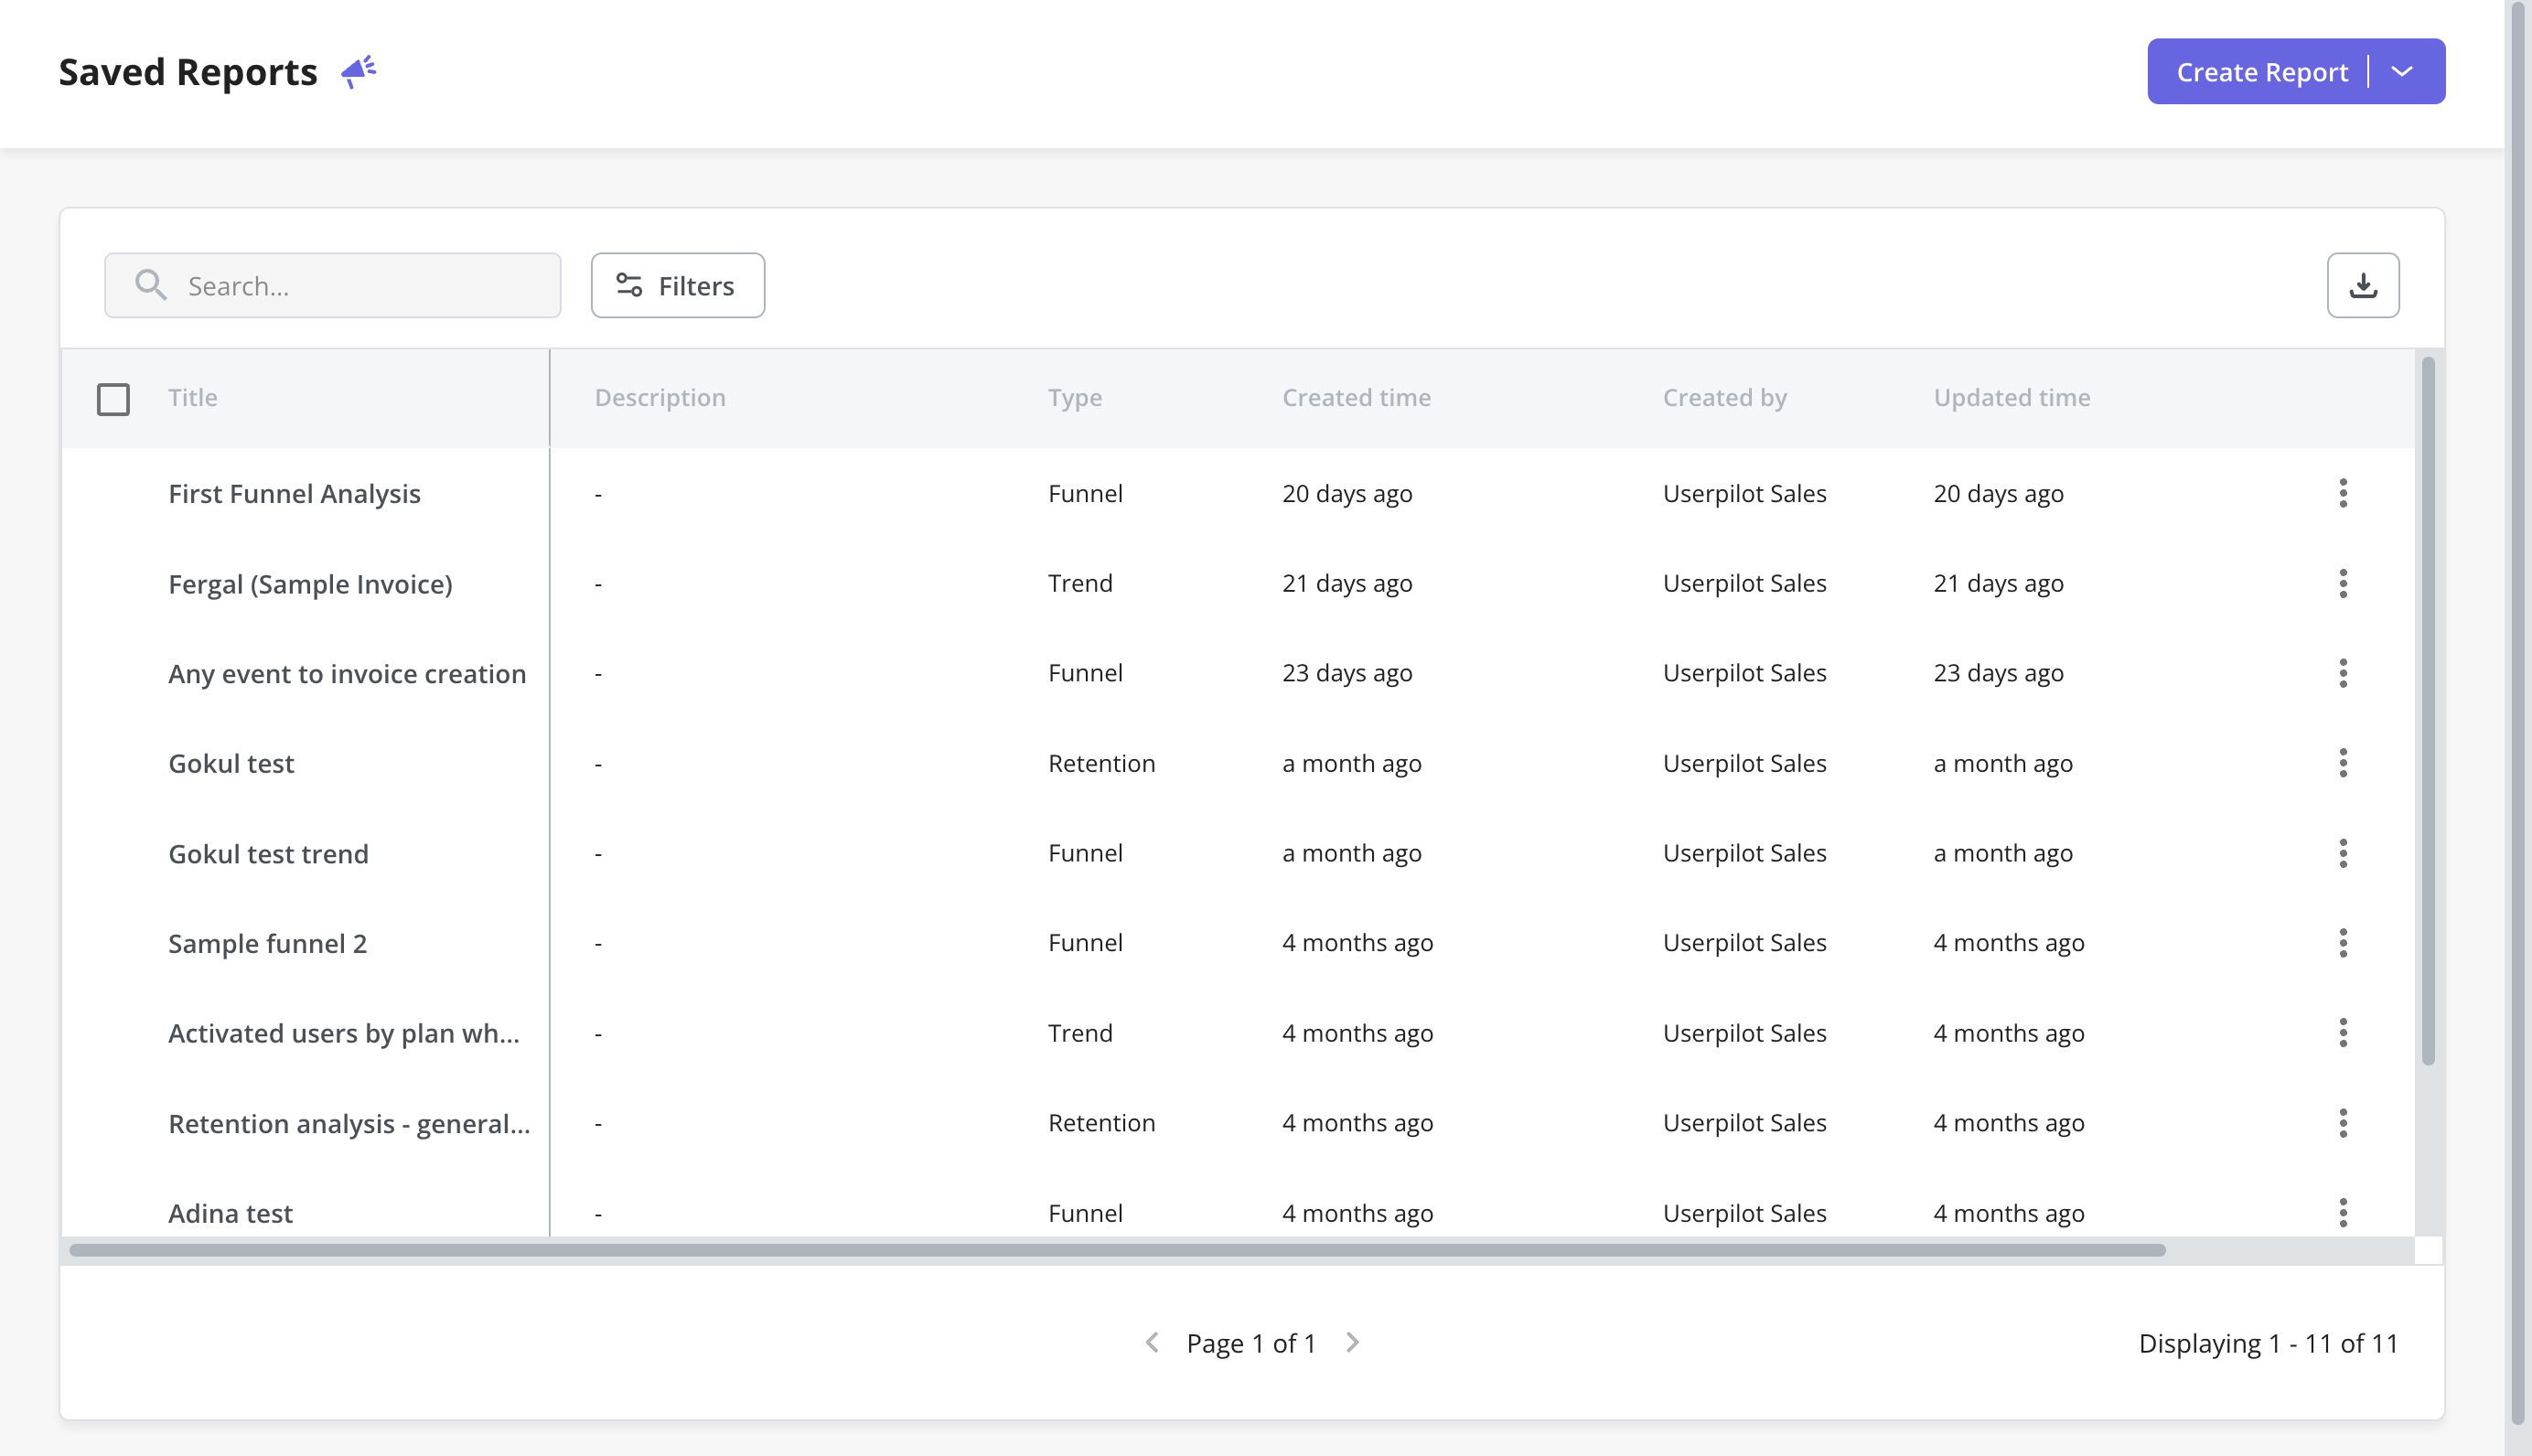
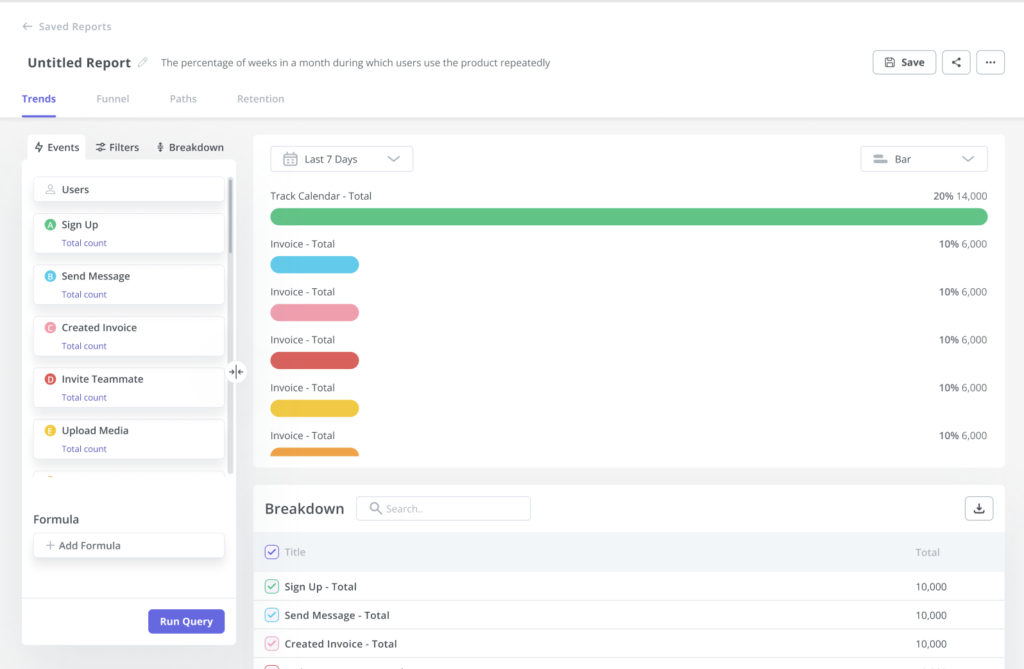
- Saved reports: With Userpilot, you can create funnels, trends, retention tables, and path reports. The saved reports dashboard lets you view, edit, duplicate, or delete any trend and funnel reports you’ve created. You’ll also be able to sort by report type, filter by the teammate who created the report, or export in bulk if you need a CSV of your user analytics.
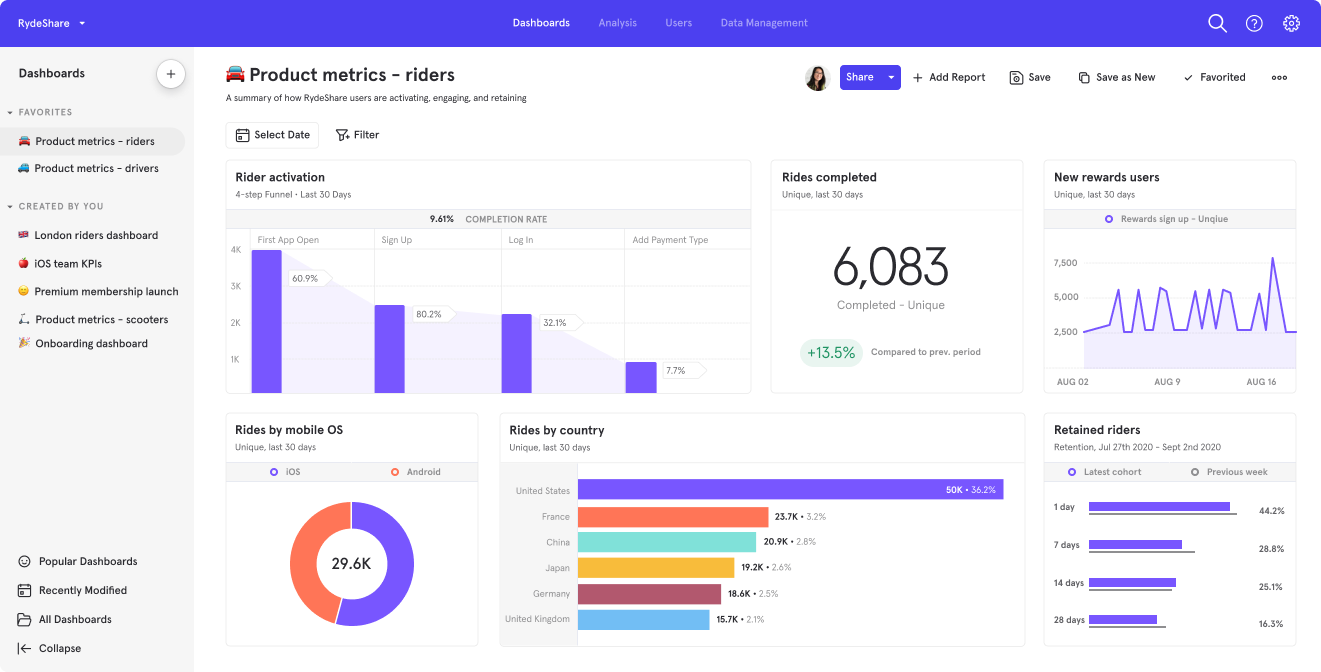
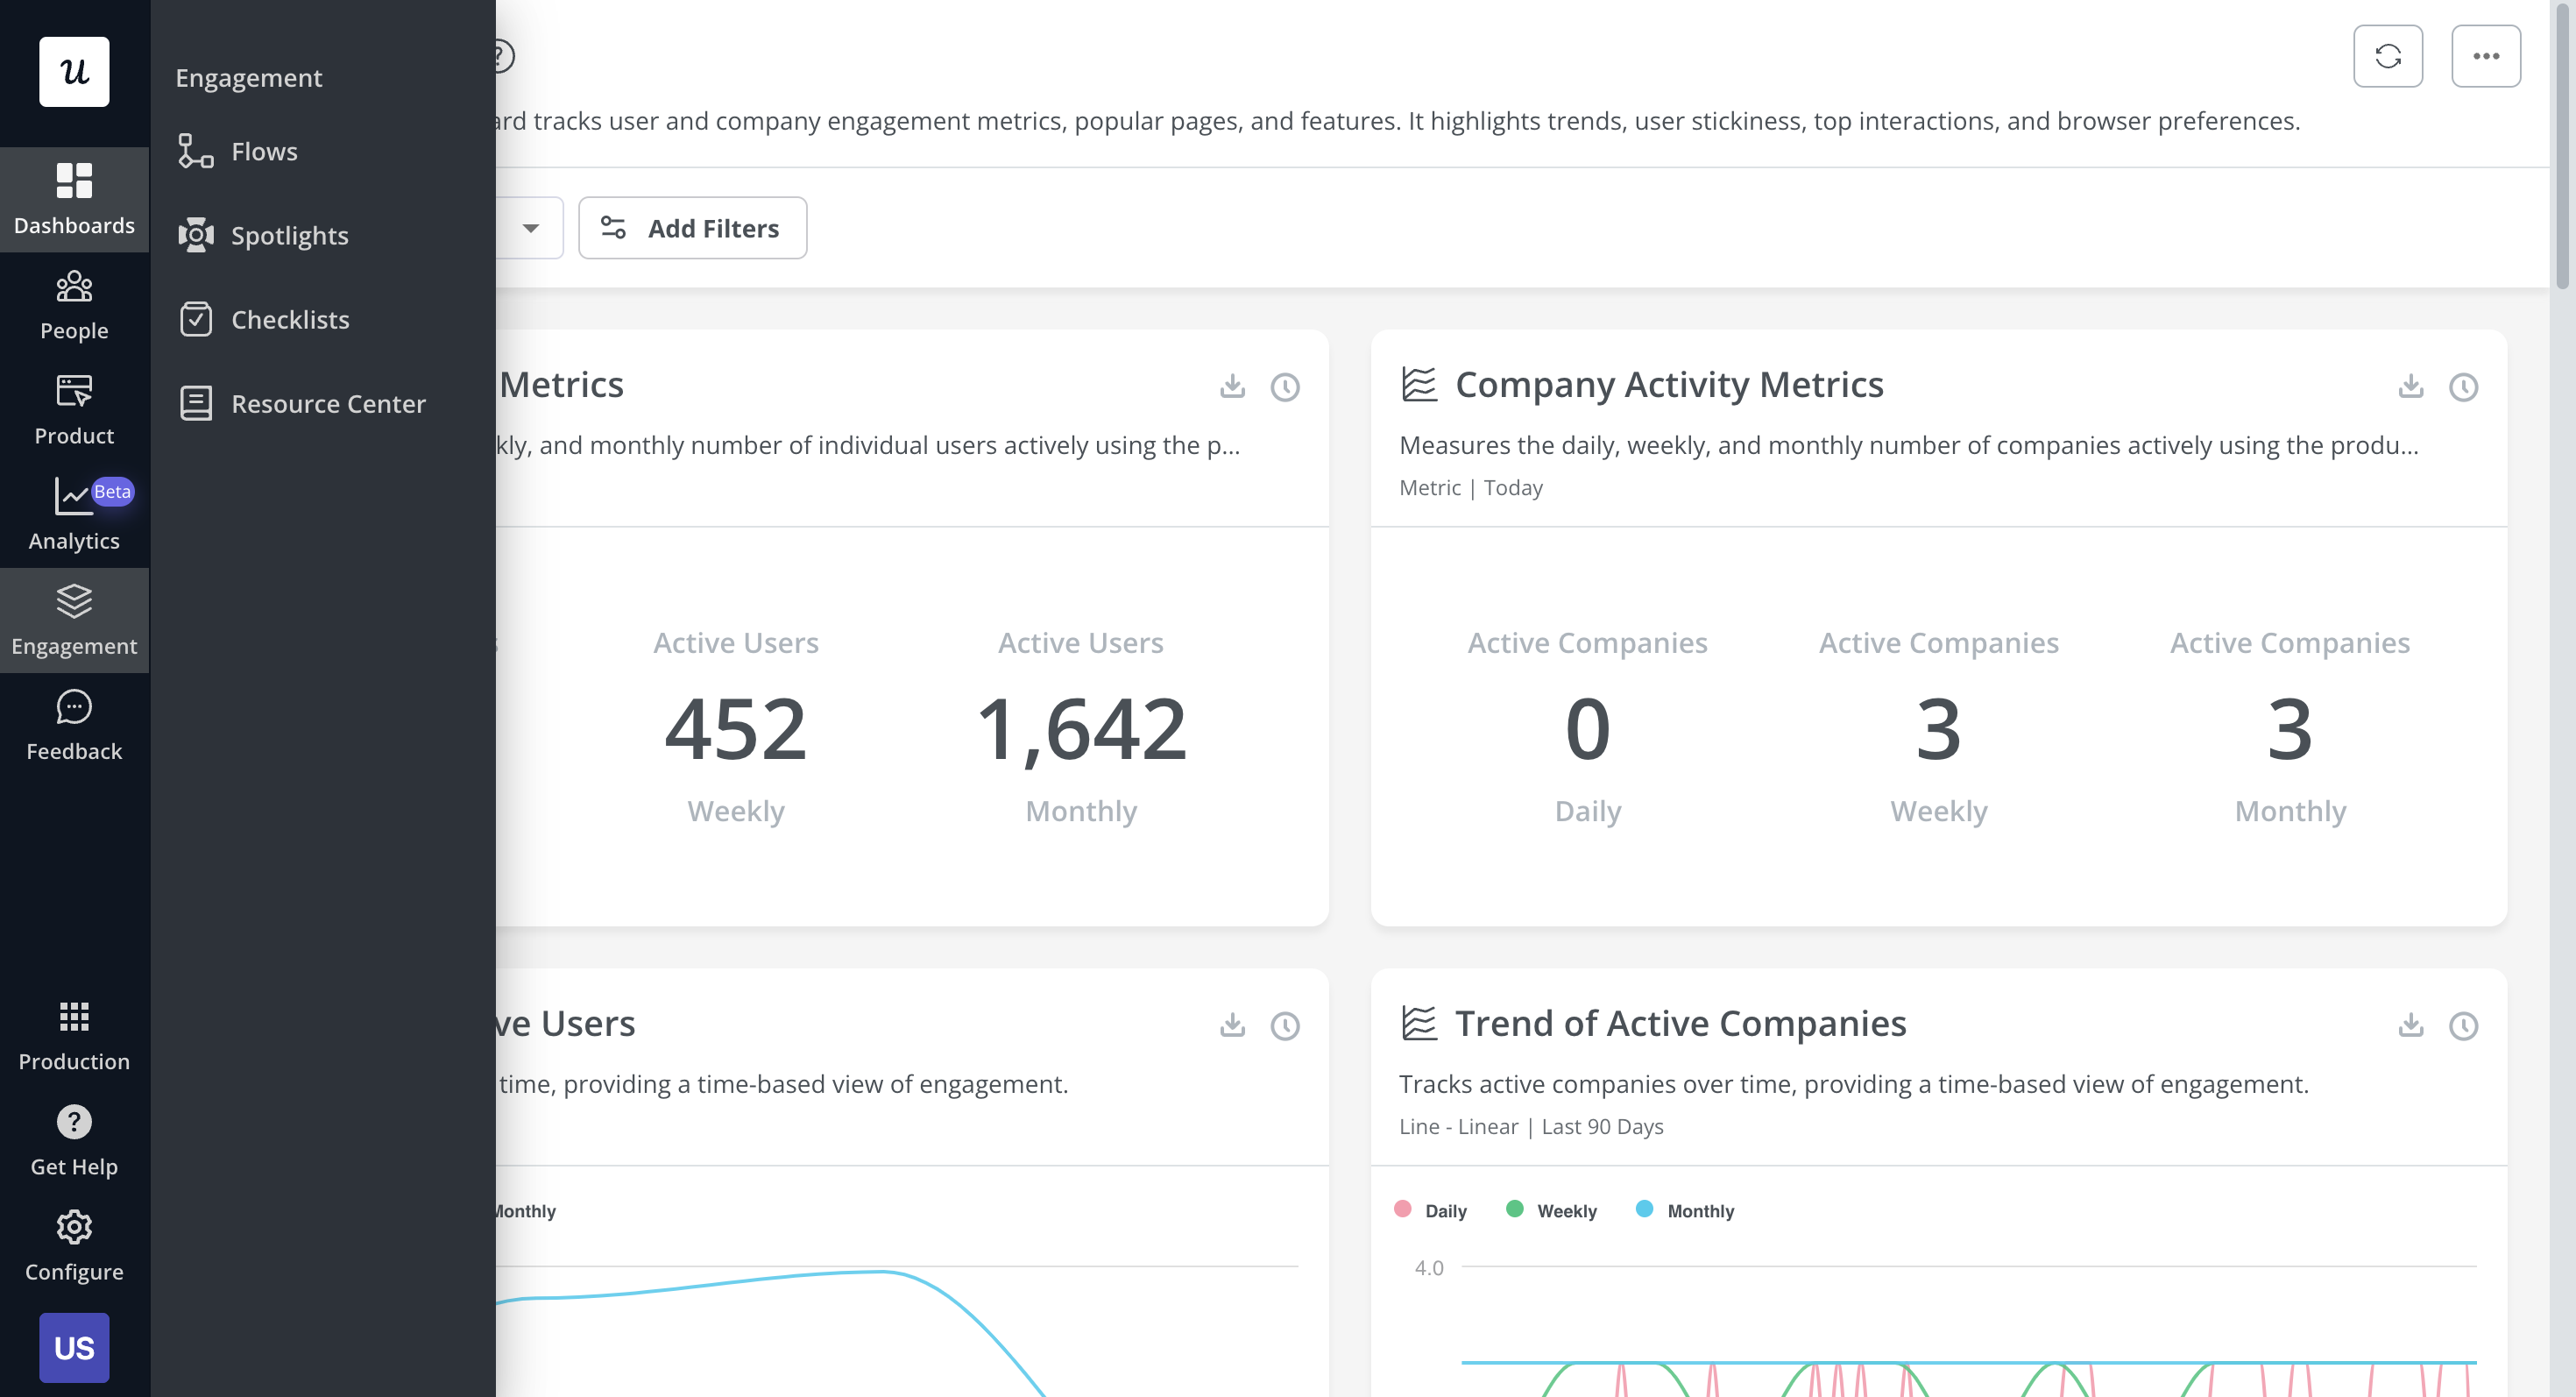
- Dashboards: Once you log in to Userpilot, you will see a collection of dashboards that collects all your key product metrics like product usage, user activation, feature engagement, etc. These dashboards are automatically available without you having to set anything up.

Types of analytics dashboards available in Userpilot currently.
Userpilot’s user segmentation analysis
User segmentation is a key part of building a contextual onboarding experience for new customers. Userpilot lets you segment your customers when they meet specific conditions, filter through analytics using user attributes, and trigger flows for users in different segments.
Here are some of Userpilot’s customer segmentation capabilities:
- Conditional Segments: Userpilot lets you build segments for users who match conditions on what device/browser/OS they’re using, which country they live in, what their NPS score is, and any custom events they’ve performed. You can then use these segments as filters/triggers.
- Analytics Filters: The product analytics and user insights dashboards on Userpilot can be set to only show data from certain user segments or companies. This makes it possible to identify actionable insights from specific user cohorts and benchmark performance between segments.
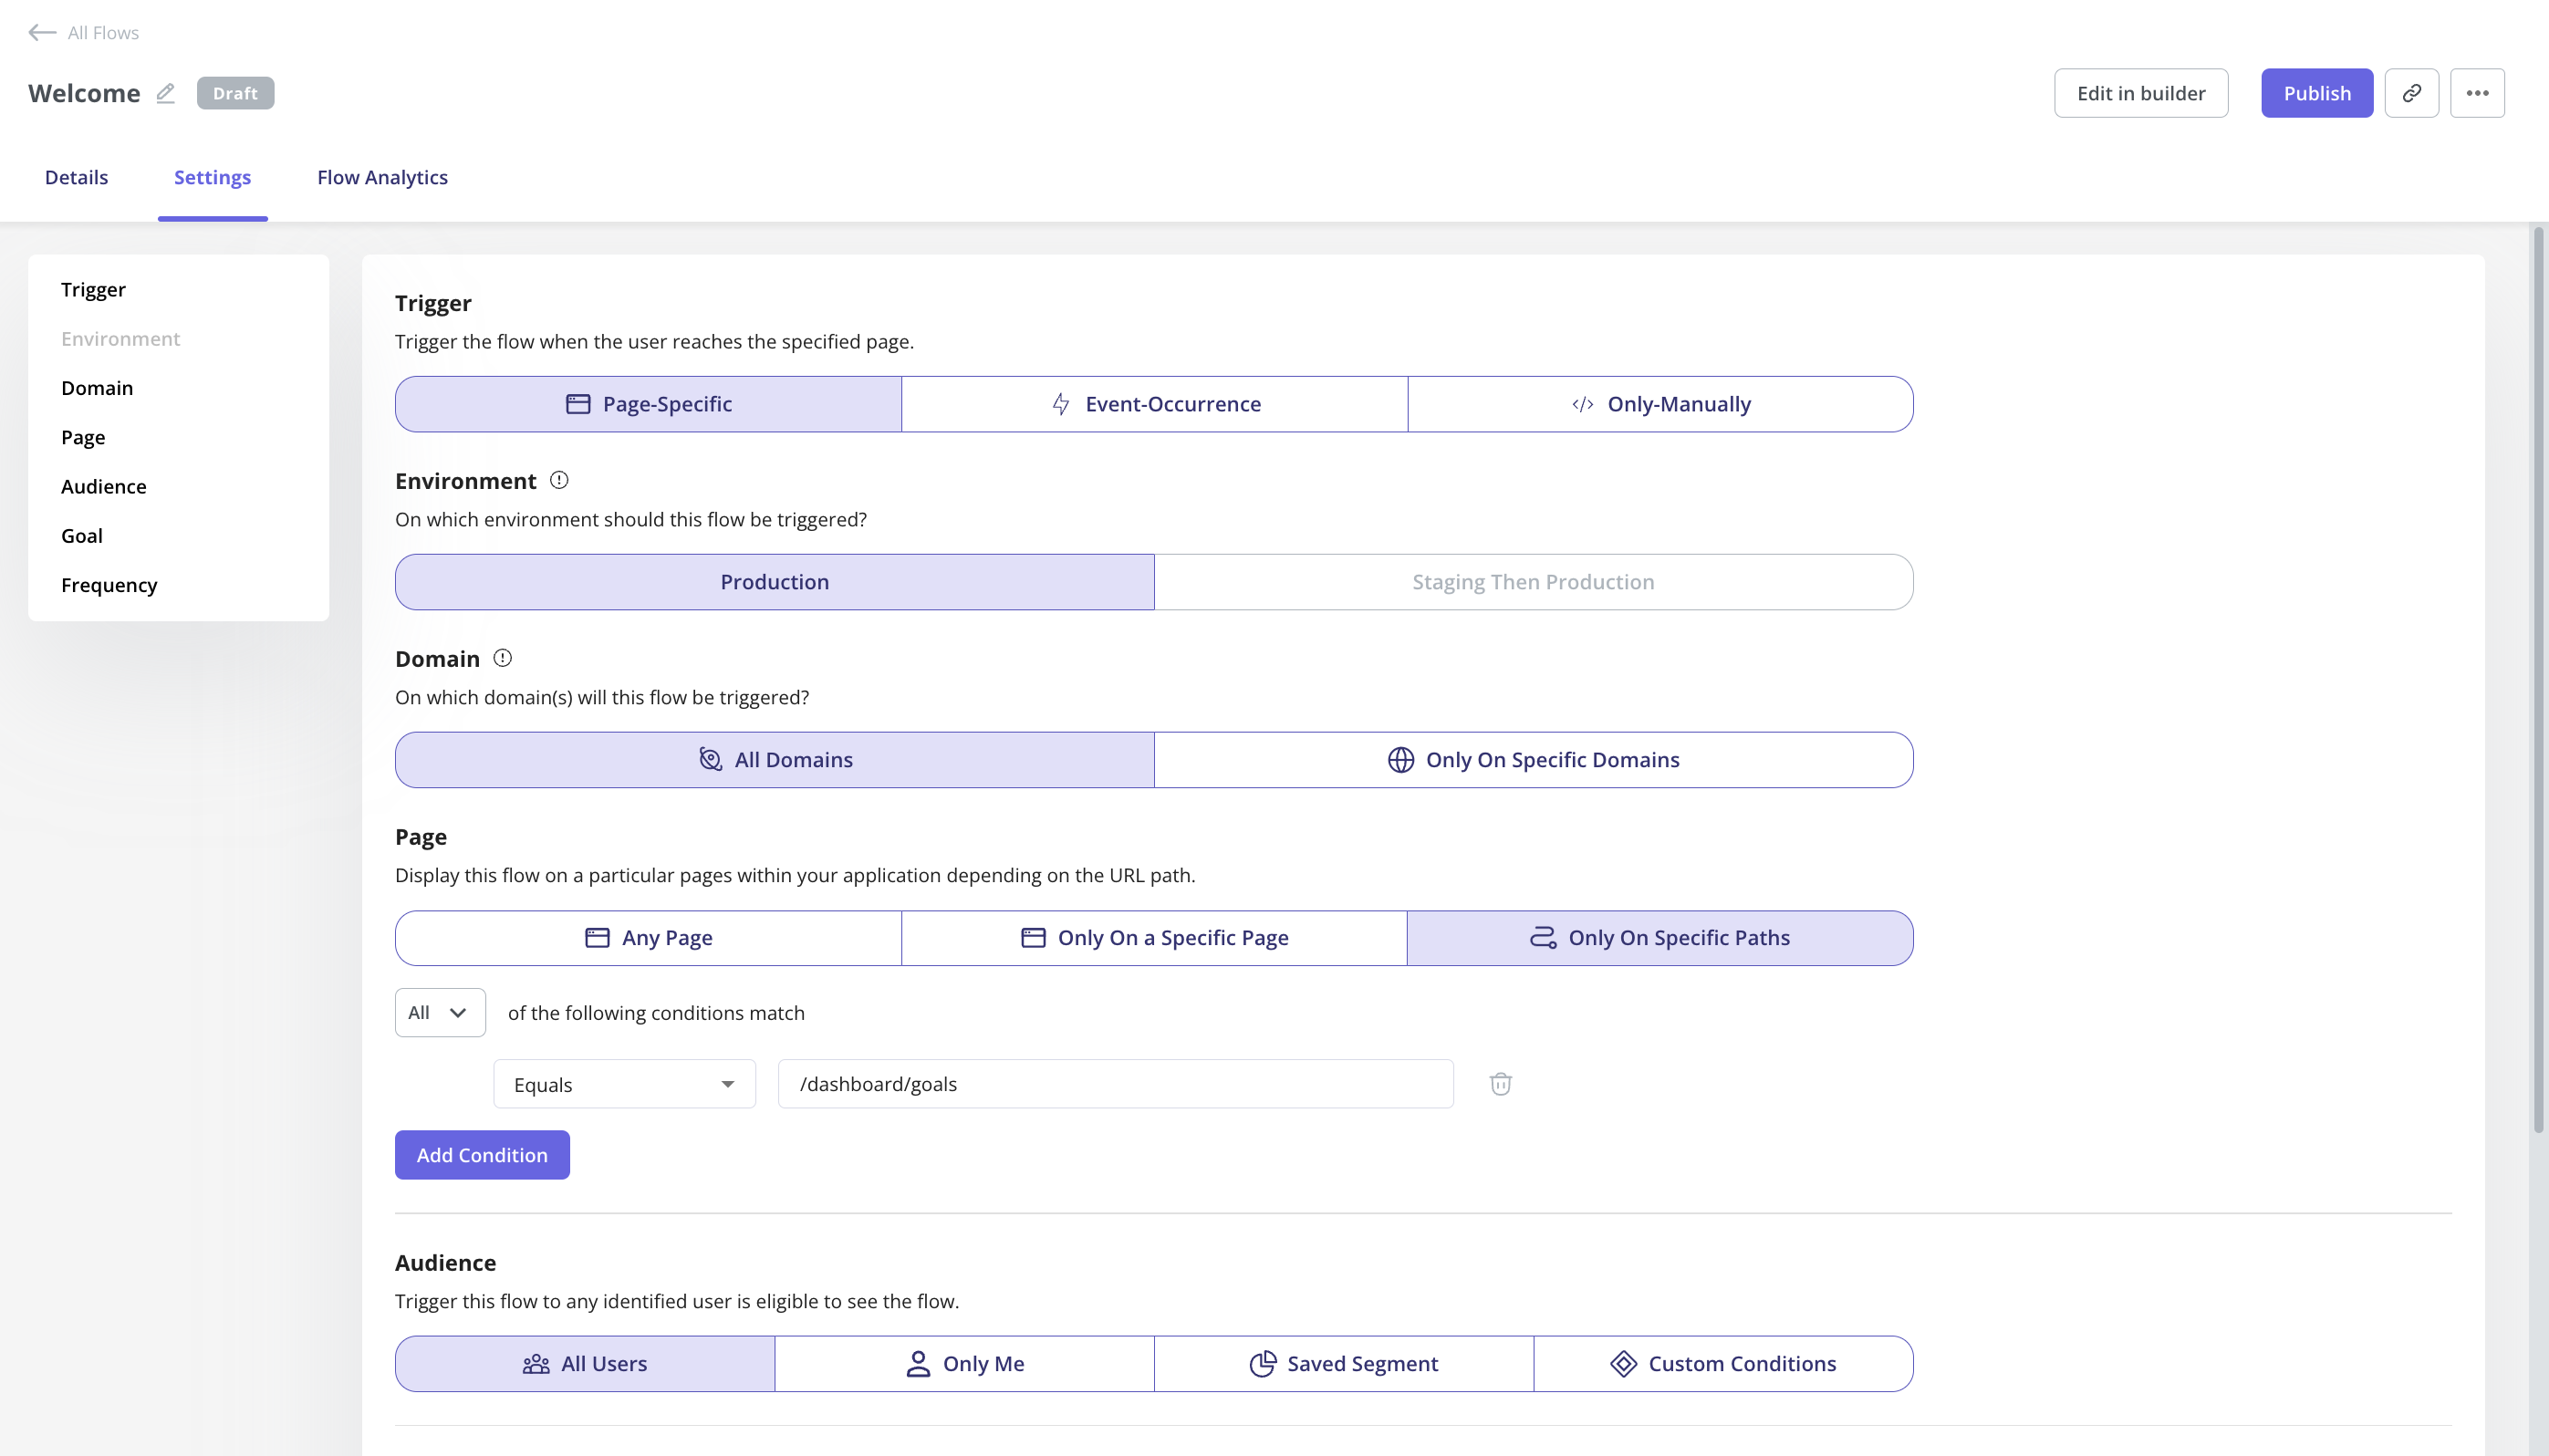
- Flow Triggers: Userpilot audience settings make it possible to target in-app flows to certain user segments or only show flows to users who meet specific conditions. You could also add event-based or page-specific triggers to show relevant flows with contextual timing.
Userpilot’s survey analytics
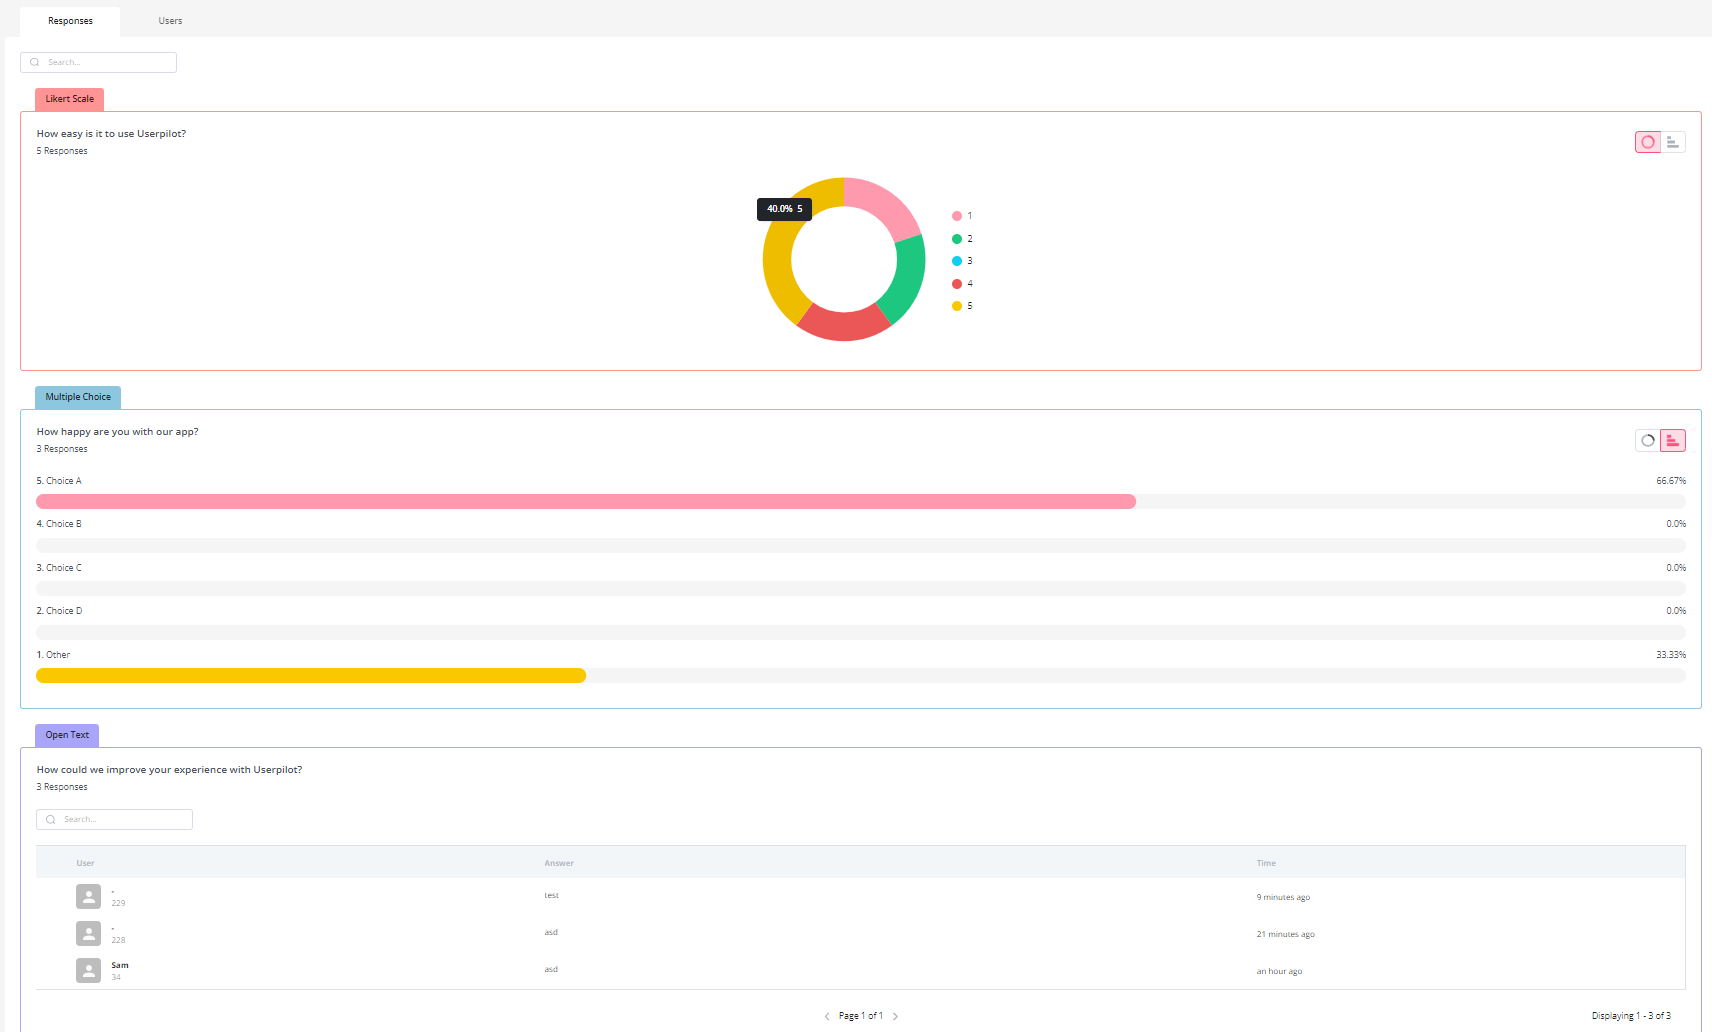
Survey analytics are an essential part of extracting actionable insights from user feedback. Userpilot’s advanced analytics capabilities extend to any surveys you build with it. You’ll be able to see granular analytics for surveys, sort by audience or time period, and view NPS data separately.
Here’s an overview of the Userpilot features you can use during survey data analysis:
- Granular analytics: Each survey you create has its own analytics tab where you’ll be able to see which percentage of respondents chose a particular option, view the most popular choices, and review qualitative responses of users. You can also sort by segment, company, or time period.
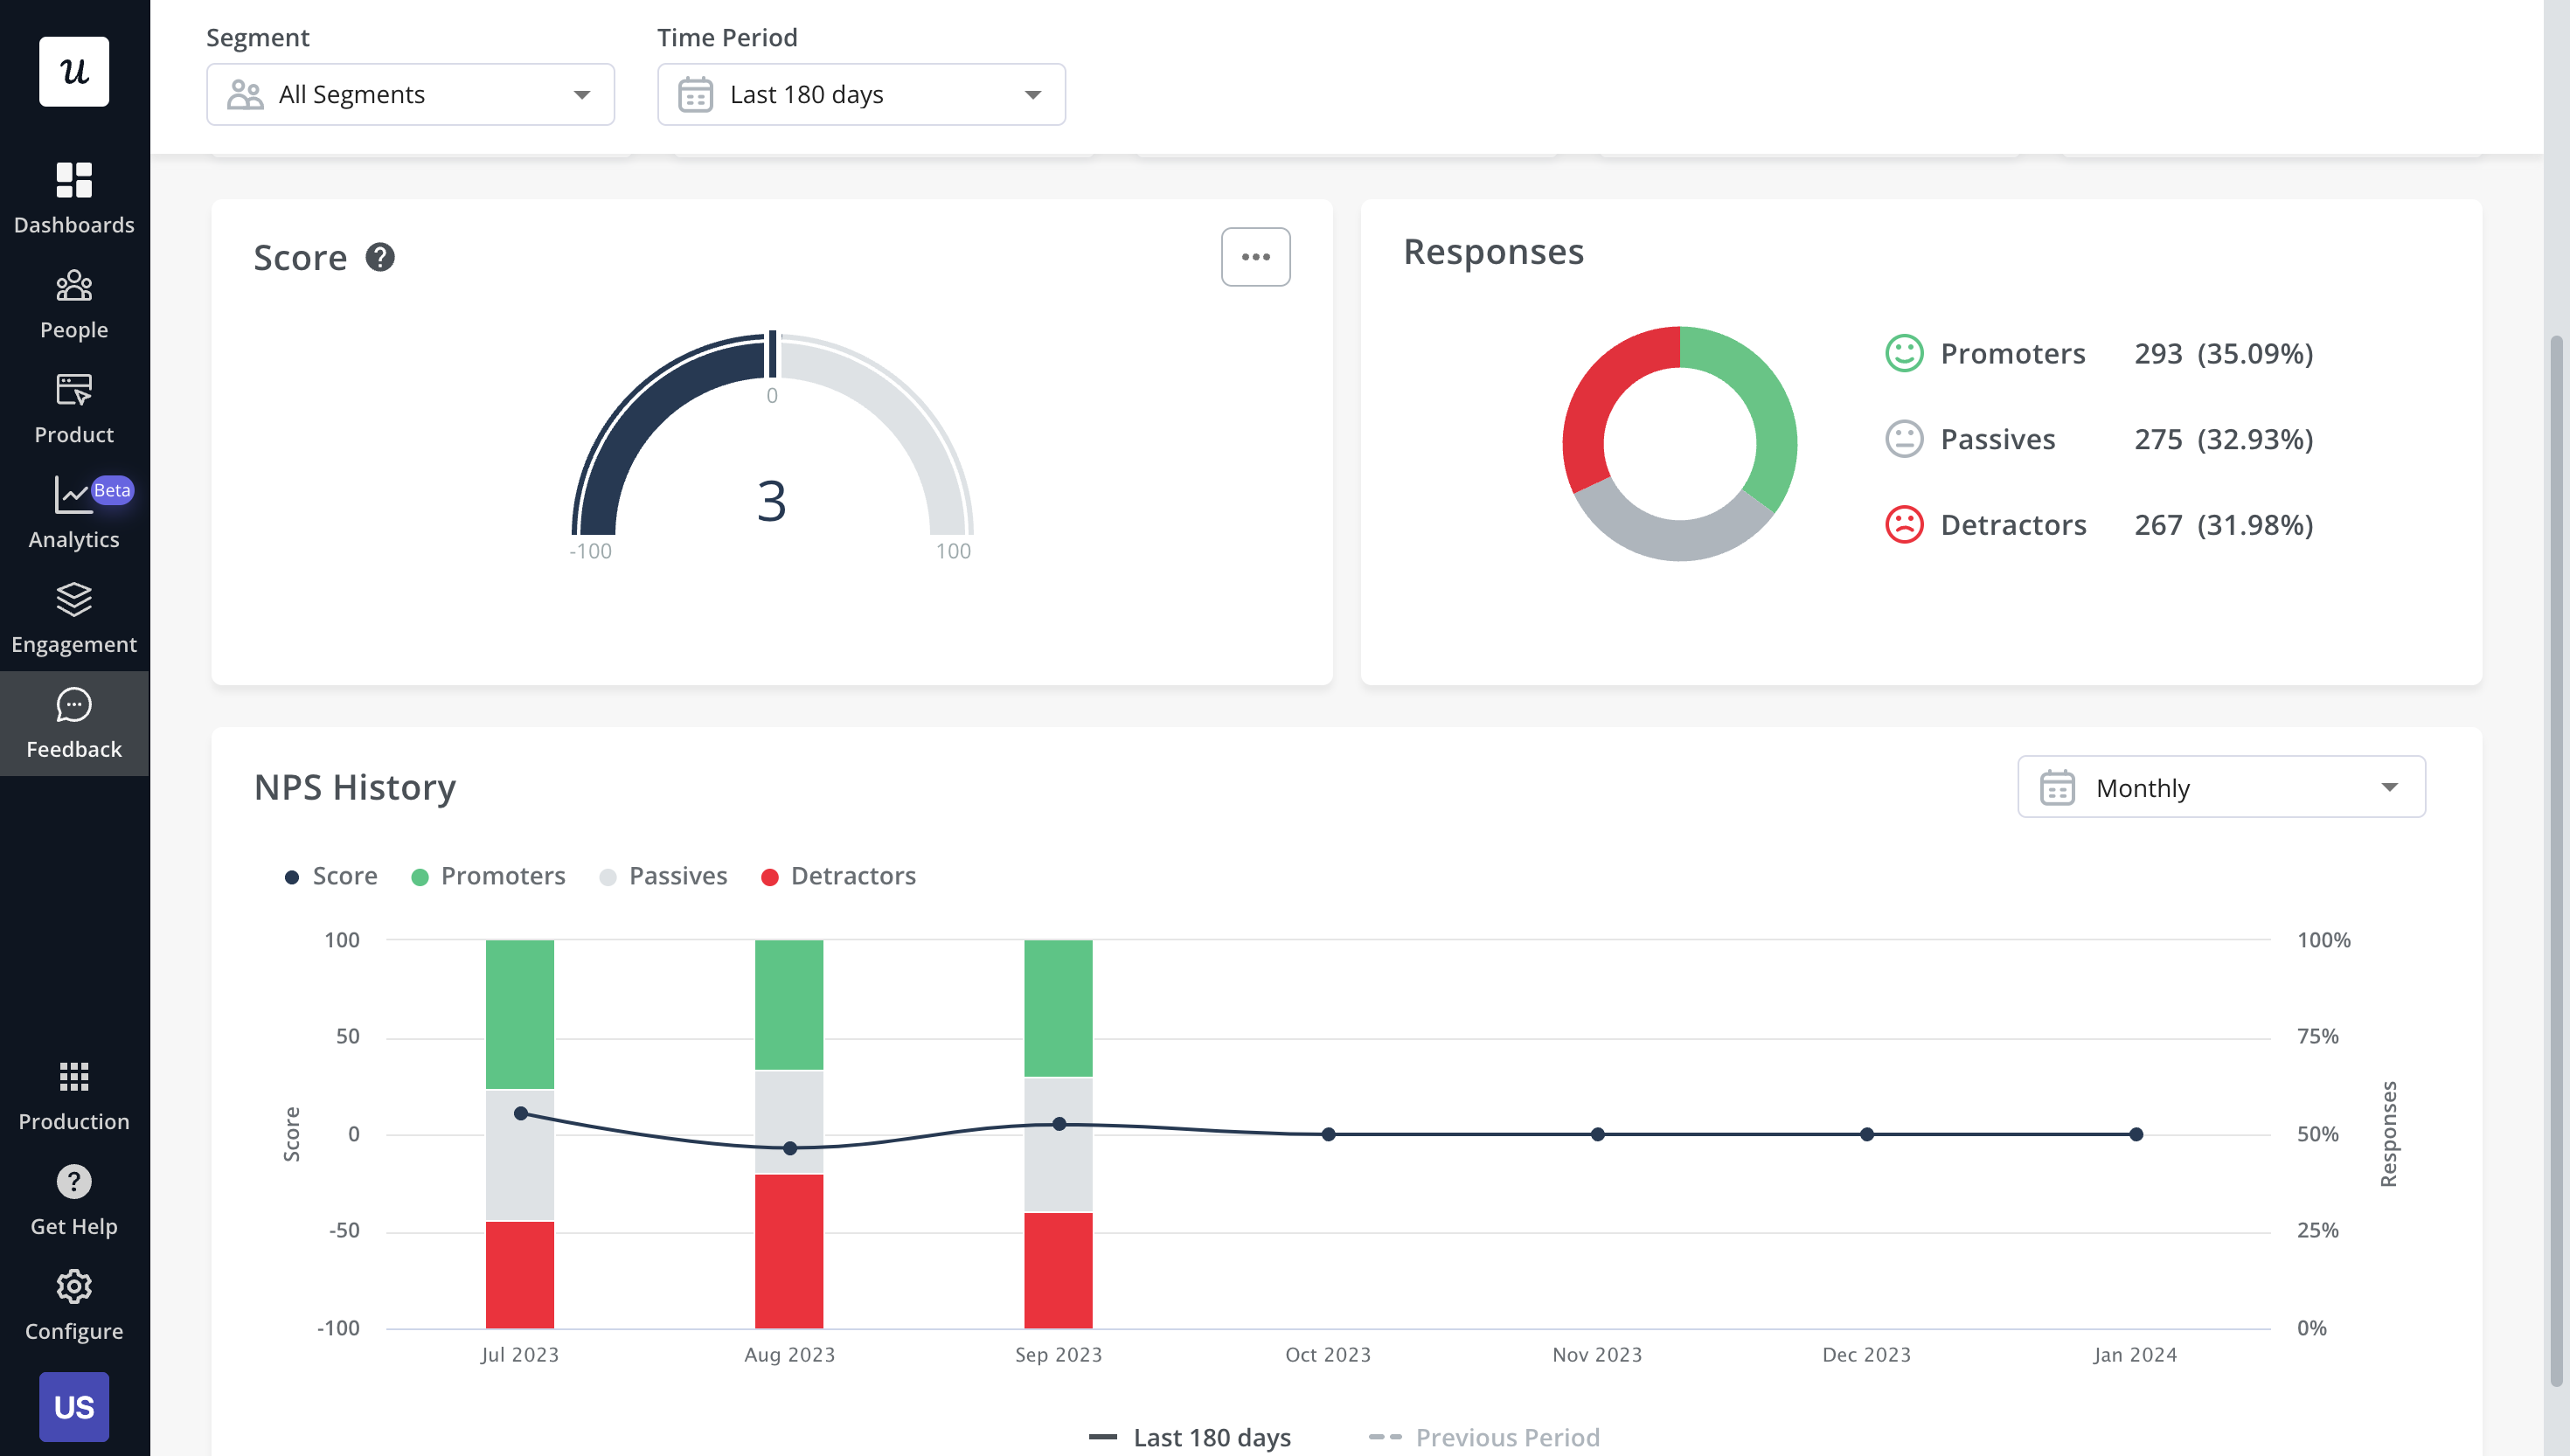
- NPS dashboard: The dedicated NPS dashboard compiles survey responses to show you all relevant Net Promoter Score data in one place. This includes total views, NPS score, total responses, overall response rate, the number of qualitative responses, and how NPS is trending over time.
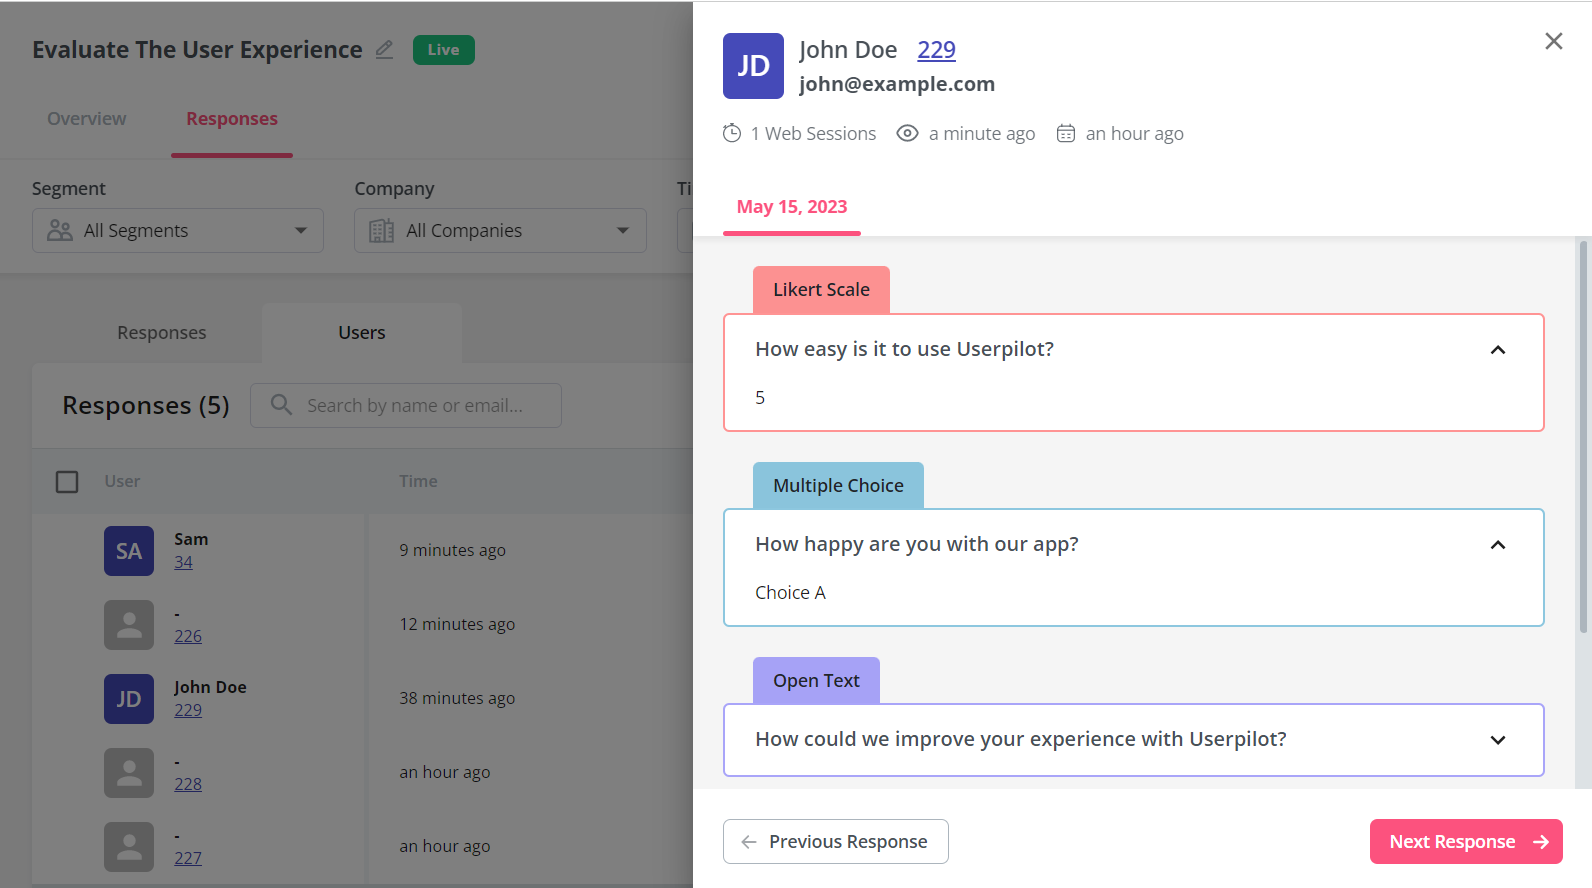
- User responses: Userpilot lets you review the responses of each individual user so you can see how sentiment differs on a customer-to-customer basis. This makes it easier to schedule follow-up interviews or implement suggestions made by users with the highest lifetime value (LTV).
Userpilot’s user journey mapping
User journey mapping helps you visualize all the interactions between users and your product as they try to achieve a particular goal. Userpilot’s detailed user analytics and funnel/trend reports help you track customers as they progress through different stages of their journey.
Here are the Userpilot features you can use for user journey mapping:
- User analytics: The Users dashboard provides detailed analytics of your entire customer base. You’ll be able to sort by segment, company, or time period and add multiple filters to help you narrow results. You can also perform bulk actions and export user data in a CSV format.
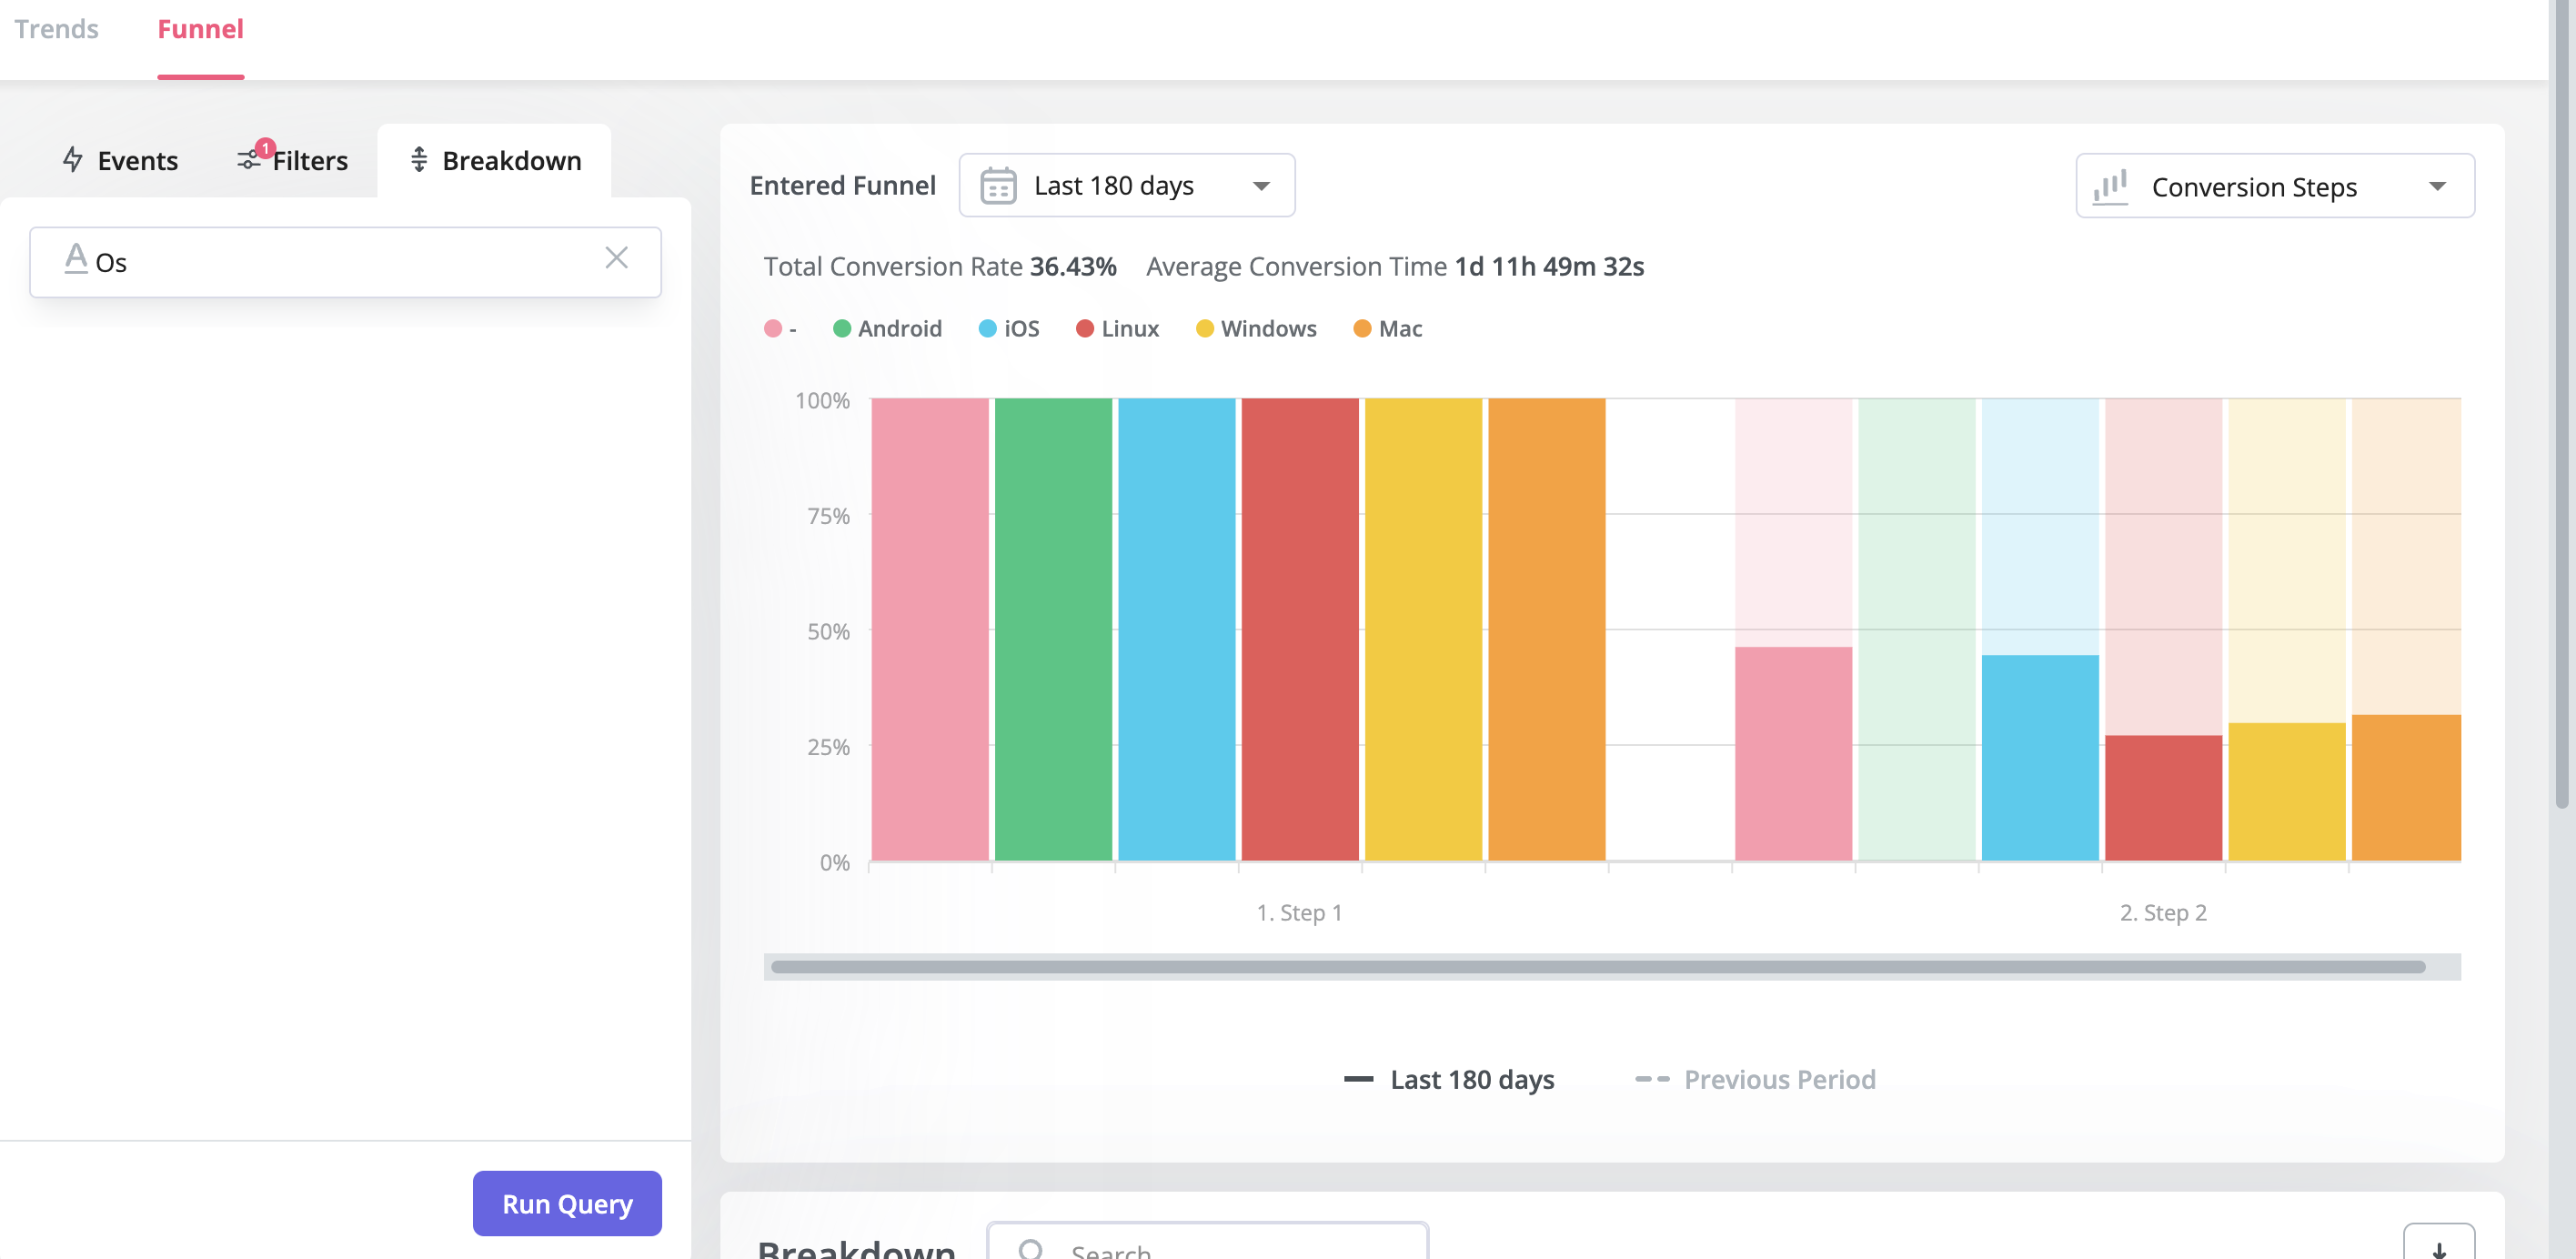
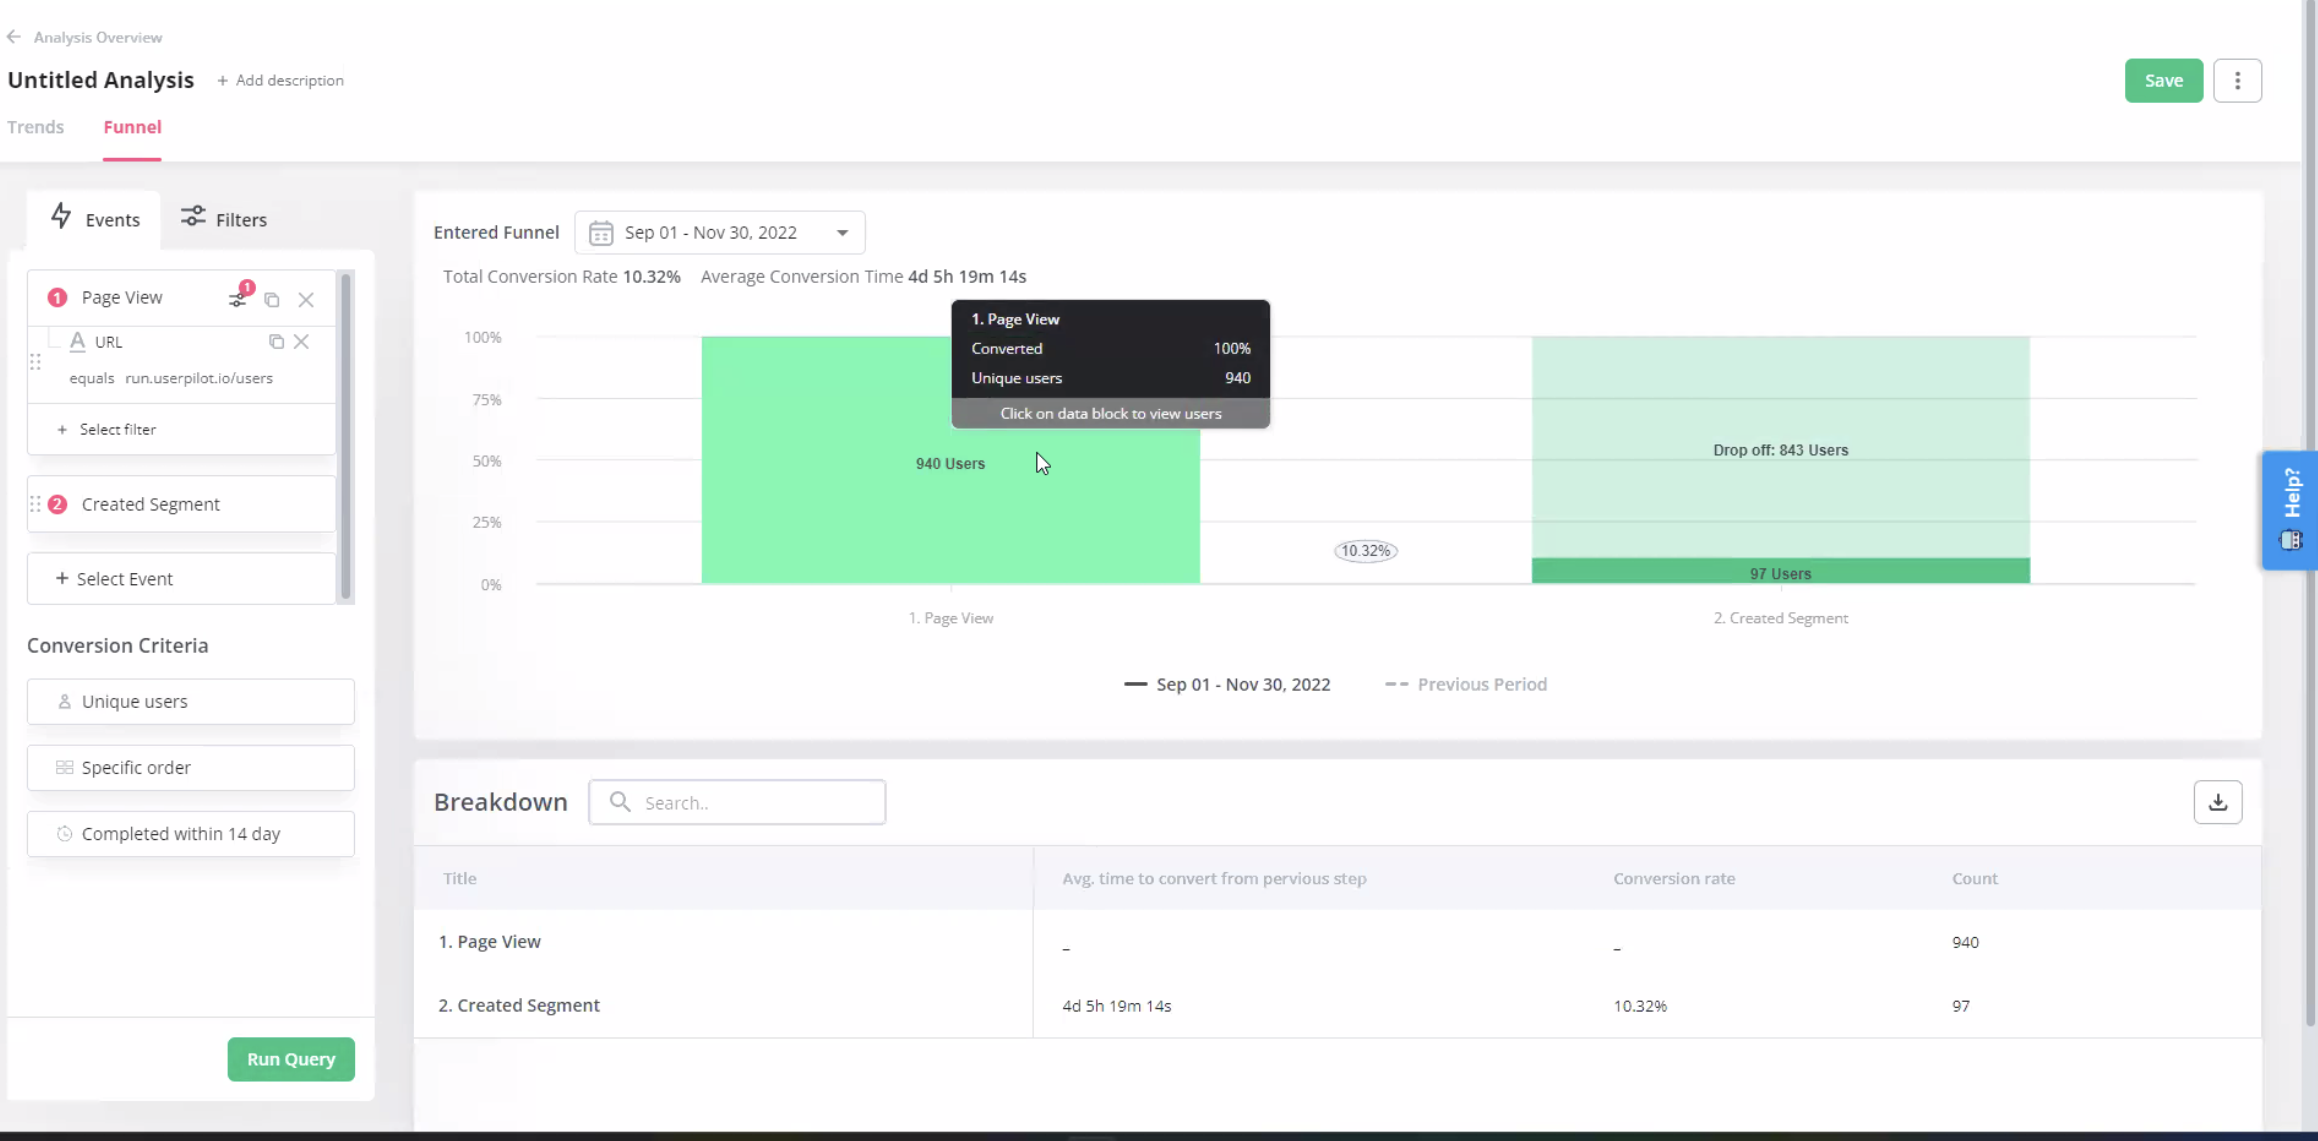
- Funnel reports: These reports help you visualize the user journey map by showing which stage, page, or action most users get stuck on. You’ll also be able to view breakdowns so you can see how the user journey changes depending on which OS, browser, or device type a user is on.
- Trend reports: Userpilot’s trend reports offer behavioral insights such as how often users perform a specific action, the number of unique users who take that action, and where in the user journey these actions occur. You can also create custom metrics and build your own charts.
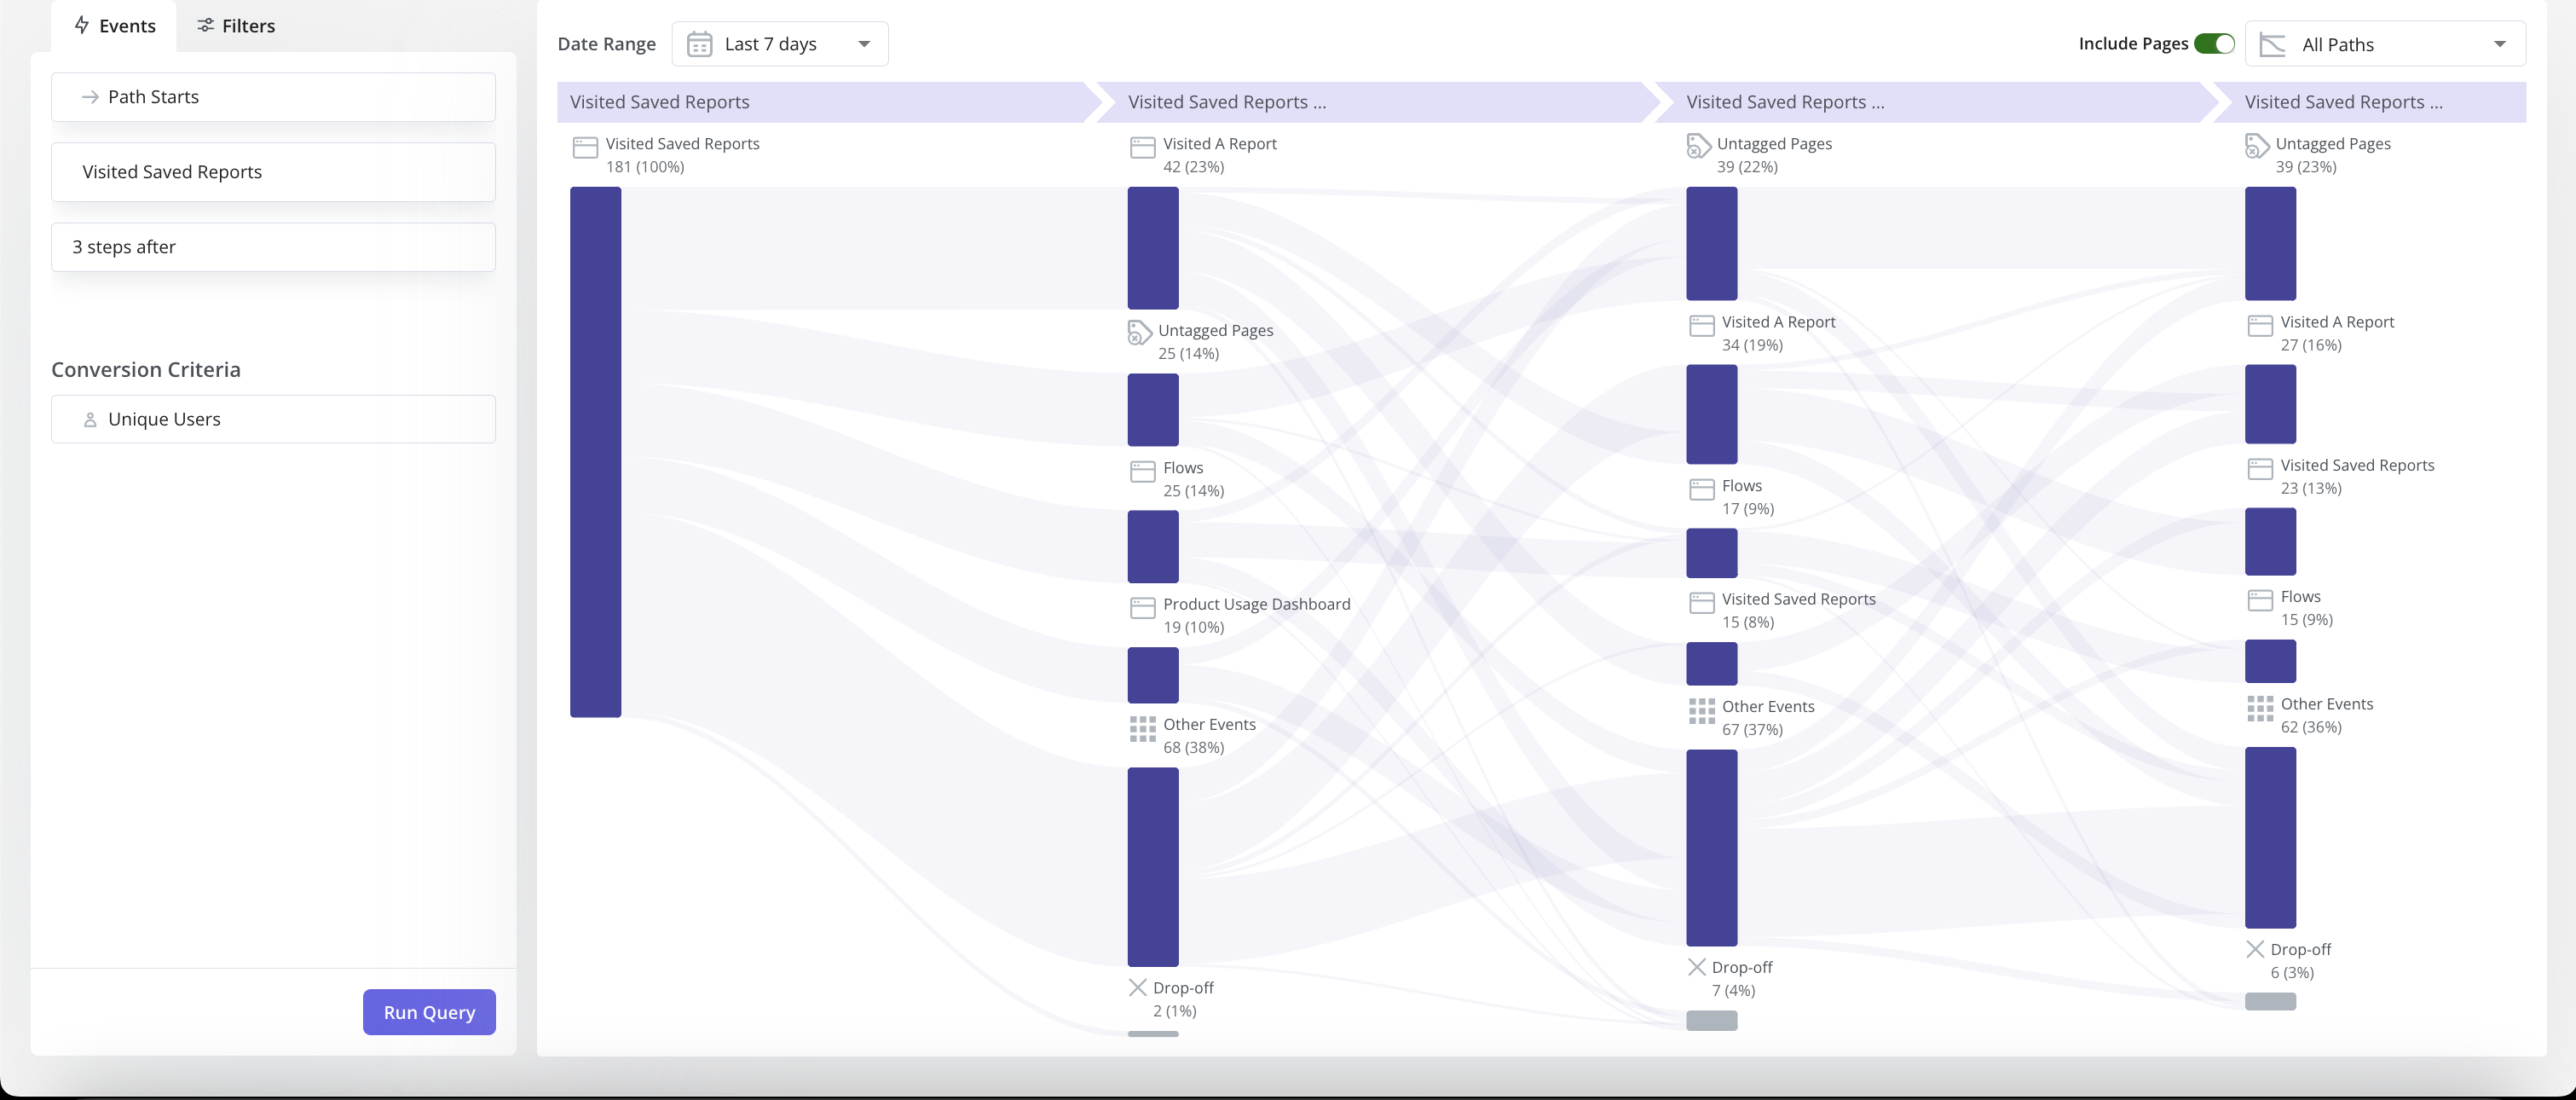
- Path reports: You can generate and access path reports directly within the reporting builder in Userpilot, alongside funnels, trends, and retention reports. With Paths, you have a better understanding of user flows and journeys – how customers interact with your products, navigate the features, etc.

Userpilot’s behavioral analytics
Behavioral analytics make it possible to monitor user activity, group data into cohorts, and extract relevant metrics/insights. Userpilot lets you tag features to see how users interact with them, compare goals by cohort, and create trend reports that track behavioral patterns over time.
Here are some Userpilot features you can use for user behavior tracking:
- No-Code Feature Tagging: Userpilot’s click-to-track feature tagger lets you mark features, buttons, and elements with the Chrome extension. You’ll be able to track user interactions such as clicks, hovers, or inputs to get an accurate behavioral view for specific features.
- Funnel Reports: Funnel reports show you the total number of users that enter a funnel and the percentage of users that complete each step. This can help you track behavioral paths and see which stages most users get stuck on.
- Trends Reports: Generating trends reports will help you visualize the occurrence of key events over time and break down these analytics by device, browser, operating system, country, signup date, or even individual user IDs and email addresses to see granular behavioral analytics.
- Path Reports: Path analysis is useful for understanding common user behavior patterns, gauging user interactions with UI, monitoring if users follow recommended workflows, and identifying points of drop-offs and areas for improvement. With collected events, you can easily set up Path analysis in Userpilot without coding.
What are the pros and cons of Userpilot?
Userpilot pros
As a full-suite digital adoption platform, Userpilot has all the features you need to onboard users, track analytics, and gather feedback from customers without writing a single line of code. Here are a few pros of using Userpilot as your product growth solution:
- No-code builder: Userpilot’s Chrome extension lets you build flows, add UI elements, and tag features without writing a single line of code.
- UI patterns: There are plenty of UI patterns to choose from when using Userpilot, such as hotspots, tooltips, banners, slideouts, modals, and more!
- Startup-friendly: Userpilot’s entry-level plan gives you access to all available UI patterns so you can hit the ground running.
- Walkthroughs and flows: Build engaging interactive walkthroughs and personalized onboarding flows that target specific segments of your user base.
- Self-service support: Build an in-app resource center to help users solve problems, customize its appearance to align it with your brand, and insert various types of content (videos, flows, or chatbots) to keep your customers satisfied.
- A/B testing: Userpilot’s built-in A/B testing capabilities will help you split-test flows, iterate on the best-performing variants, and continually optimize based on user behavior.
- Feedback collection: Userpilot has built-in NPS surveys with its own unified analytics dashboard and response tagging to help you retarget users. There are other survey types to choose from and you can even create your own custom survey.
- Survey templates: There are 14 survey templates to choose from so you can gather feedback on specific features or run customer satisfaction benchmarking surveys like CSAT and CES.
- Advanced analytics: Userpilot lets you analyze product usage data, monitor engagement on all in-app flows, and use the data to create user segments that are based on behaviors instead of demographics.
- Event tracking: Userpilot’s no-code event tracking lets you tag UI interactions (hovers, clicks, or form fills) and group them into a custom event that reflects feature usage.
- Third-party integrations: Userpilot has built-in integrations with tools like Amplitude, Mixpanel, Kissmetrics, Segment, Heap, HubSpot, Intercom, Google Analytics, and Google Tag Manager so you can share data between all the solutions in your tech stack.
Userpilot’s cons
Of course, no tool is perfect and there are a few cons to consider before choosing Userpilot as your user onboarding or product growth solution:
- Employee onboarding: Currently, Userpilot only supports in-app customer onboarding.
- Mobile apps: Userpilot doesn’t have any mobile compatibility which could make it difficult for developers with cross-platform applications to create a consistent user experience for both versions of their product.
- Freemium plan: There’s no freemium Userpilot plan so those bootstrapping their startup and need sub-$100 solutions should consider more affordable onboarding platforms like UserGuiding or Product Fruits.
What do users say about Userpilot?
Most users laud Userpilot for its versatile feature set, ease of use, and responsive support team:
I recently had the pleasure of using Userpilot, and I must say it exceeded all my expectations. As a product manager, I’m always on the lookout for tools that can enhance user onboarding and improve overall user experience. Userpilot not only delivered on these fronts but also went above and beyond with its impressive new features, unparalleled ease of use, and truly exceptional customer support.
What truly sets Userpilot apart is its outstanding customer support. Throughout my journey with Userpilot, the support team has been responsive, knowledgeable, and genuinely dedicated to helping me succeed. Whenever I had a question or encountered an issue, their support team was always there to assist promptly, going above and beyond to ensure my concerns were addressed effectively.
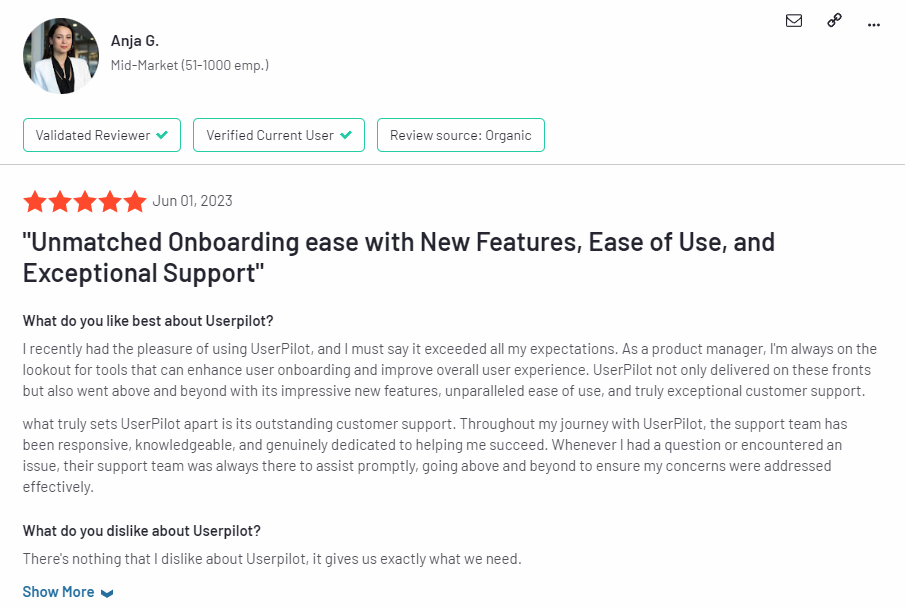
Source: G2.
Of course, other users are also kind enough to share constructive criticism regarding specific features like event tracking filters:
“The filtration while analyzing specific events is a little confusing. Understanding of custom properties and data management configuration could have been more organised.”
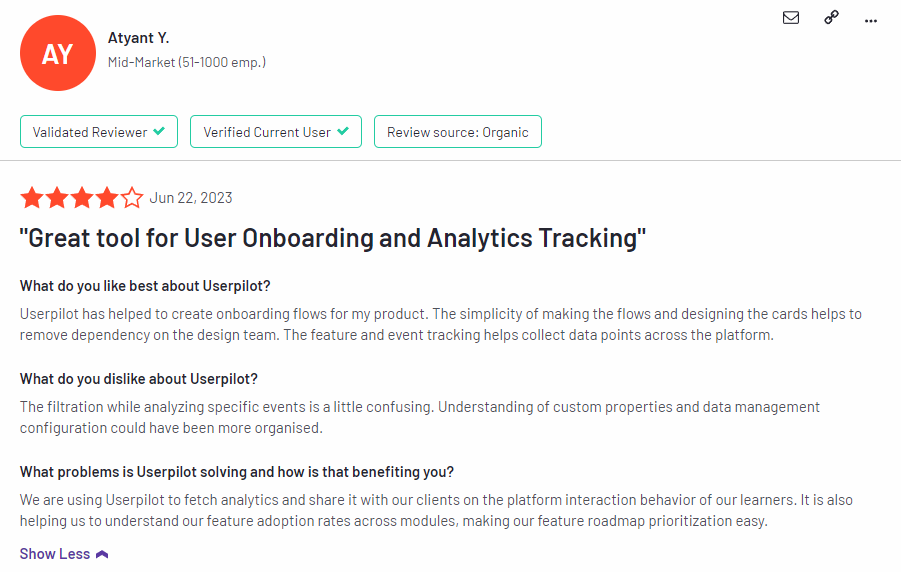
Source: G2.
Userpilot’s pricing
Userpilot’s transparent pricing ranges from $249/month on the entry-level end to an Enterprise tier for larger companies.
Furthermore, Userpilot’s entry-level plan includes access to all UI patterns and should include everything that most mid-market SaaS businesses need to get started.

Userpilot has three paid plans to choose from:
- Starter: The entry-level Starter plan starts at $249/month and includes features like segmentation, product analytics, reporting, user engagement, user feedback, and customization.
- Growth: The Growth plan starts at $499/month and includes features like resource centers, advanced event-based triggers, unlimited feature tagging, AI-powered content localization, EU hosting options, and a dedicated customer success manager.
- Enterprise: The Enterprise plan uses custom pricing and includes all the features from Starter + Growth plus custom roles/permissions, access to premium integrations, priority support, custom contract, SLA, SAML SSO, activity logs, security audit and compliance (SOC 2/GDPR).
Conclusion
There you have it.
It should be easier now to make an informed decision whether Mixpanel is your go-to option for User analytics. Ultimately, the best choice will depend on your product and current needs.
If you’re looking for a better alternative to Mixpanel for User analytics, book a Userpilot demo today to experience firsthand how it can enhance your user experience and drive product growth!
![]()
Looking for a Better Alternative for User Analytics? Try Userpilot!

