article thumbnail

This Message Will Self-Destruct in 33 Seconds

Tom Tunguz

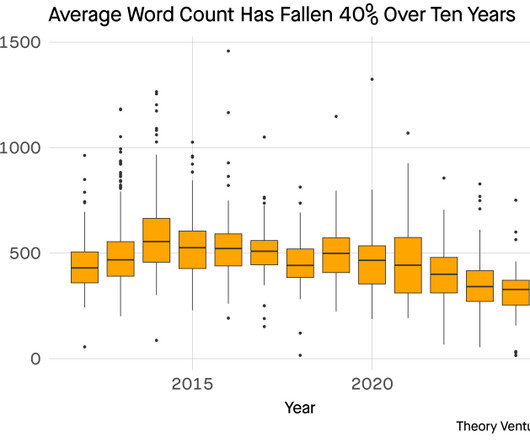
In 2013, the average reader dwelled on this site for 47 seconds. So, in ten years, when I update this data, expect it to be in a haiku like this one: Attention span drops, From one fifty to forty-seven, Web’s brief dance evolves. Today, it’s 33 seconds, a 3.6% decline - which is a bit better !

Metrics 303
article thumbnail

The Software Industry's Productivity Boom: Analyzing Revenue per Employee Trends

Tom Tunguz

Compare that to the benchmarks in 2013! In 2013, the average revenue per employee of these companies totaled $200k. Company RPE 2013, $k RPE 2023, $k CAGR CRM 325 375 1.4% The data suggests revenue per employee growth is zero dring product development. In addition to the dated charts! VEEV 200 880 15.9% NOW 143 502 13.3%

Insiders

Sign Up for our Newsletter

This site is protected by reCAPTCHA and the Google Privacy Policy and Terms of Service apply.

article thumbnail

Microsoft outlook 2013 training ppt free download –

Natalia Luneva

Looking for: Microsoft outlook 2013 training ppt free download – Click here to Download. Our new CrystalGraphics Chart and Diagram Slides for PowerPoint is a collection of over impressively designed data-driven chart and editable diagram s guaranteed to impress any audience. Make the switch to Excel Sort and filter data.

article thumbnail

My App Stack: Kyle Coleman, CMO at Clari

SaaStr

Other than your own, what app would you never let anyone take away from you no matter what: Looking through previous answers, everyone correctly points to their data / analytics systems as being irreplaceable. Kyle’s foray into B2B tech sales started in 2013 when he joined Looker as the 6th employee. The phone app on my iPhone.

ChatGPT 212
article thumbnail

Monetizing Analytics Features: Why Data Visualizations Will Never Be Enough

Think your customers will pay more for data visualizations in your application? Five years ago they may have. But today, dashboards and visualizations have become table stakes. Discover which features will differentiate your application and maximize the ROI of your embedded analytics. Brought to you by Logi Analytics.

article thumbnail

The Best Time of Year to Raise for Your Startup

Tom Tunguz

I’ve plotted the data above & smoothed it to clarify the patterns. In 2013, the surge in June/July & December stand out. I set out to determine if fundraising seasonality had changed from this post I published in 2014 which suggested Q2 & Q4 were best for founders. The answer is yes. Set that aside.

Startup 240
article thumbnail

Winning with Data

Tom Tunguz

There’s a new class of company that wield data to create long-term competitive advantage. TheRealReal uses this morning’s sales data to inform this afternoon’s marketing campaigns. I first saw the impact of this type of data informed decision-making at Google. The best run companies use data to win.

Data 100