article thumbnail

Mean Reversion: When Will Startup Investing Return to Normal?

Tom Tunguz

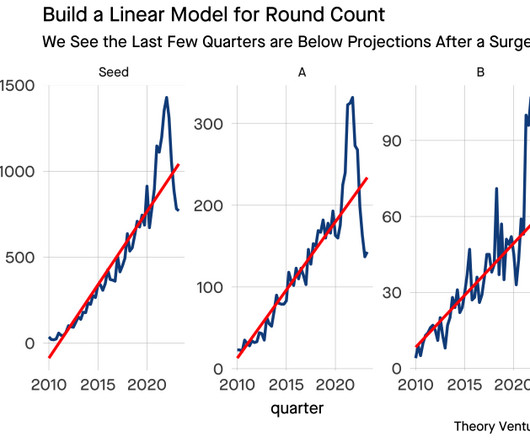
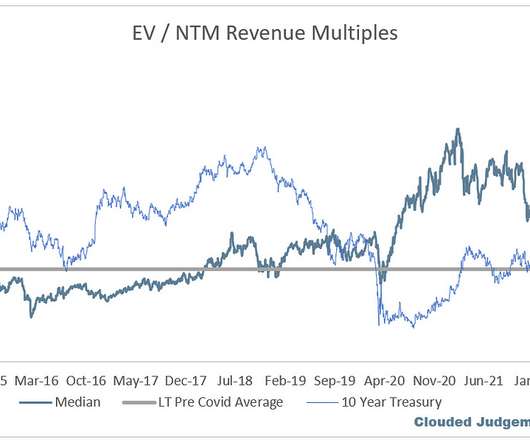
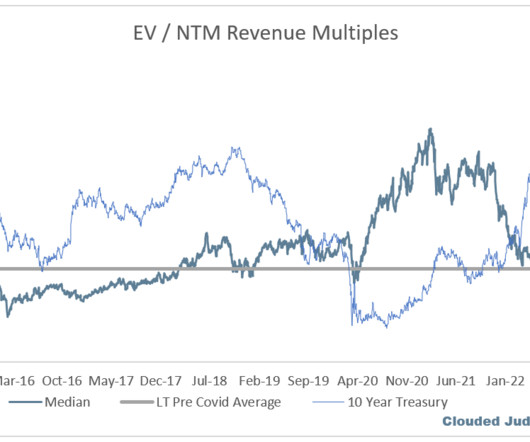
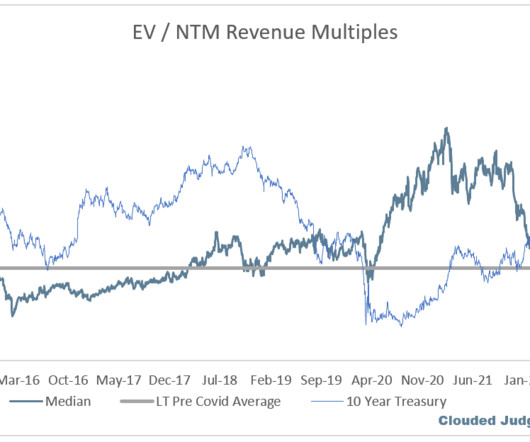
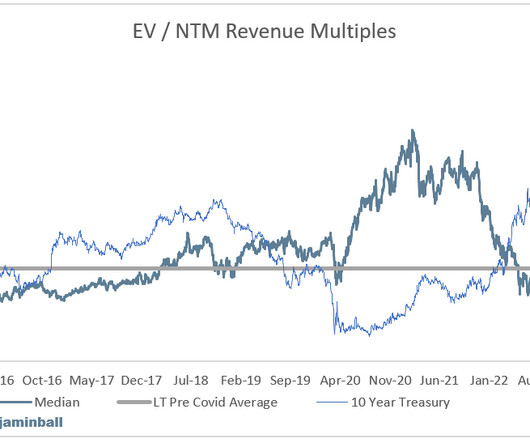
The red is a linear model based on data from 2010 to 2018 that predicts activity rates for each financing series of US & Canadian software companies. [1] By looking at the cumulative rounds since 2010, we can see that Seed, A, & B volumes all trended meaningfully above their predicted counts. But the gap is narrowing.

article thumbnail

Is Compensation Stagnation to Blame for the Great Resignation?

Tom Tunguz

Let’s compare data from 2010 and 2021 to understand the longitudinal trends in cash and equity compensation. A VP of Engineering in a Bay Area startup that has raised less than twenty-five million dollars earned 33% more in 2021 than 2010. 2010 Equity. Cash Change. A nice bump. 2021 Equity. Equity Change.

Insiders

Sign Up for our Newsletter

This site is protected by reCAPTCHA and the Google Privacy Policy and Terms of Service apply.

article thumbnail

What Could the Venture Market Look Like in the Coronavirus Era

Tom Tunguz

The market bounced back to similar levels once in Q2 2010, but needed eight quarters to return to its previous volumes. Let’s break down the trends by series. The Series B market had a nice resurgence as well, followed by a retrenchment in late 2010 and then another surge. in the quarters following the crash.

Marketing 310
article thumbnail

The Radically Different Early Stage Fundraising Market

Tom Tunguz

The top left chart shows a $1M round had about 41% market share in 2010; that grew to about 54% in 2014; now it has fallen to 35%. But is now at the same level it was in 2010. In 2010, it was very likely that a business raised a $1M round before raising a $3-5M dollar round. The $3M round has suffered a similar loss of share.

Marketing 200
article thumbnail

Clouded Judgement 10.20.23 - Hyperscaler Q3 Preview

Clouded Judgement

Every week I’ll provide updates on the latest trends in cloud software companies. For context on a 10Y at 5% - from 2010 to 2020 the 10Y averaged roughly ~2.5%. Said another way, the 10Y today is double what it averaged from 2010 to 2020. Follow along to stay up to date!

Cloud 161
article thumbnail

Do SaaS Startups Still Require Less Capital than 10 Years Ago?

Tom Tunguz

In 2010, one venture dollar bought $1.24 If we look at the ROIC across IPOs across the last 12 years or so, we see that same initial dynamic of incredibly efficient companies in the 2010 and 2014 IPO cohorts. It’s tripled from about $92m to more than $300M since 2010. One venture dollar bought forty-two cents at IPO.

Startup 267
article thumbnail

The Health of the US Venture Market in 2020

Tom Tunguz

However, Q4 2019 saw meaningful dip from Q3, but it's too early to say whether it's an aberration, or the beginning of a longer-term trend. Since 2010, the number of round by quarter has followed a periodic growth, with consistent seasonality. Mean round sizes have increased from 5 million in 2010 to 17.5

Marketing 225