

Sales forecasting… Did you just shudder?
How about pipeline reviews? Heart start to race a few beats?
For most sales reps and leaders, this is an important part of your role — and yet pipeline reviews are one of the most dreaded meetings on the calendar.
This article won’t give you the silver bullet to answer your manager’s questions about your deals but it will give you a bulletproof methodology to get within 5% of your actuals.
For sales leaders, I’ll share what data to measure, and for sales reps, this will give you a methodology to create a defensible call based on more than just your trusty gut.
You’ll learn:
- Rules for an accurate sales forecast
- Key data for sales forecasting
- Step 1: deals in commit
- Step 2: weighted pipeline of uncommitted ARR
- Step 3: forecast sales (with a future pipeline calculator)
Getting to an Accurate Sales Forecast
Accurate sales forecasting is part art but mostly science.
If done correctly, your sales forecast can act as an early indicator that your plan is working even though deals haven’t closed yet. Or it can serve as an early alarm bell that the team is trending behind, giving you time to make adjustments.
Before we get to how you’re going to look like a forecast superstar, there are a few ground rules we need to establish.
- Rule 1 – You or your sales team needs to be consistently updating your CRM with accurate deal data
- Rule 2 – You and/or your team needs to have well-defined criteria for your sales data. I’ve outlined the data points below.
RELATED: Forecasting Methods: 7 Different Approaches to Predicting Revenue
Key Data for Sales Forecasting
You need data from key 4 areas to get an accurate sales forecast. Let’s take a quick look.
Sales Stages
Having well-defined and accurate sales stages for your business is critical, particularly if you plan to leverage the weighted pipeline functionality.
Most CRMs have a baseline of stages you can easily adopt or modify for your business. An example might be:
- 15% Demo Scheduled
- 25% Demo Completed
- 50% Second Demo or POC
- 75% Contract Negotiation
- 90% Verbal
Make sure to have a definition for each of these to ensure AEs know what to select and when.
Forecast Categories
This is a secondary field you can leverage to provide visibility to upper management with a simple report.
These metrics are particularly helpful when you have a later-stage deal that an AE is uneasy about.
RELATED: Sales Forecasting 101: Definitions, Methods, Examples, KPIs
Again this is a field that most CRMs have preset with something like:
- Pipeline – typically early stage deals
- Upside – the AE is feeling good about the deal; however, they haven’t ironed out pricing, contract terms, etc.
- Commit – the AE is confident in the deal or received a verbal agreement saying the deal will come in by the close date they’ve set
Average Sales Cycle
Any AE and sales leader should know the average number of days it takes to close a deal.
If your team is segmented by market, size, or geography, you will want to run the data for each segment to determine if there is a relevant variation from the average.
If there is, make sure to use it.
Opportunity Source
Opportunity source is the generic root of where a deal most recently came from.
The common categories are
- Inbound – typically MQLs
- Outbound – most deals sourced by an SDR using proactive outreach efforts
- AE – AE generates the opportunity either through referrals or proactive outreach
Alright. Now that we got the logistics of what you need to have in place, let’s talk about how to build an accurate call.
Step 1: Deals in Commit
Well, that was easy enough. You now have the data you need to develop an accurate sales forecast.
The only caveat is this: You need to do a quick sweep to make sure the deals check all the “healthy” boxes.
Depending on your team’s criteria, a deal’s health will typically be based on:
- Decision-maker buy-in
- Urgency/deadline to make decision
- Inside average sales cycle age
- Etc.
Step 2: Weighted Pipeline of Uncommitted ARR
The next step in sales forecasting is to adjust the value in your weighted pipeline. This is where accurate sales stages are critical.
Weighted Pipeline = ARR x Probability the deal will close (a.k.a. % of sales stage)
This should be straightforward if you and/or your team are accurately managing the stages. The one caveat is if you have a wide range for your ARR.
For example, your average ARR is $9K, but you are working deals $20K+.
These deals can heavily skew your weighted pipeline number in the wrong direction. My recommendation is to stay conservative. It’s great to call out as potential upside, but unless this deal is in commit, I would remove the value from your weighted pipeline and call.
RELATED: 8 Proven Sales Forecasting Methods for Greater Accuracy
Step 3: Forecast Your Sales (With a Future Pipeline Calculator)
If you’ve ever wanted to know how to forecast your sales, here’s the answer: Don’t guess. If you know your numbers, you can come up with an accurate (and realistic) sales forecast.
Let me explain…
Depending on the period of time you have to generate a call for, you may have pipeline that doesn’t yet exist that could close in that timeframe.
What do I mean by that?
Let’s say it’s the start of a new quarter and you need to provide a call for the quarter. The challenge is this: Your average sales cycle is 50 total days, which means you technically still have nearly half the quarter to generate opportunities that could raise your call.
If this has ever happened to you, I’m guessing you just call quota right? That way your boss stays off your back and you still have enough time that you could make that happen if you really want.
MAYDAY! This hurts you for two reasons:
- It’s a guess based on nothing
- You don’t know what the actual gap is to hitting your quota for the month
Fortunately for you, hope doesn’t have to be a strategy. Instead you can use this nifty future pipeline calculator to help you use data to generate a realistic number based on facts.
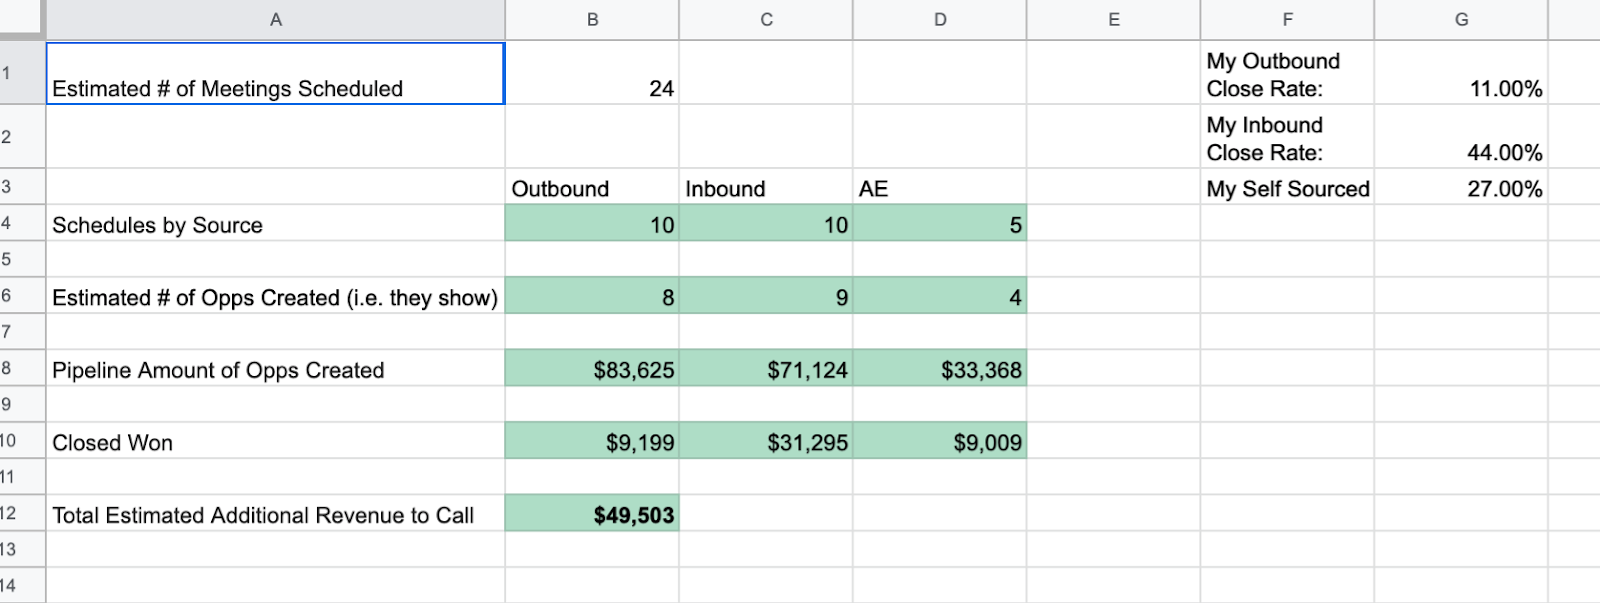
Access the Future Pipeline Calculator Here
So how does it work? To get started you’ll need the following data:
# of Opportunities Created for the Remaining Period – In the example given above, you have six weeks of pipeline you can generate that will influence your call for this quarter. Take a look at the last 3–12 months to see on average how many opportunities were created/week. Let’s say it was 4. That means your # of opportunities is:
4 opps per week x 6 remaining weeks to influence pipeline
= 24 New Opportunities
Pipeline Generated by Source – What percent of the pipeline is AE sourced, Inbound, and Outbound?
Average ARR – If there is a major discrepancy based on source, I recommend getting granular and using the average ARR by source. Typically, since Outbound deals are hunted, these tend to be larger than inbound. In my last company, our Outbound deals are 35% larger than Inbound deals
Winrate by source – If you don’t have this data, you can use industry benchmarks for software:
- Outbound/AE Sourced – 20%
- Inbound – 40%
Here’s what it looks like:
As long as you have the data then you can program your calculator to spit out a realistic revenue number that you can add to your commit and weighted pipeline.
Happy Hunting!


