
When your website isn’t producing the results you want, there’s likely some kind of problem standing between website visitors and conversion. Fix that problem and you’ll see more engagement and a higher conversion rate, right?
Much of the content written about how to improve your website offers a bunch of generic tips for improving your site. And, of course, there’s a certain allure to the idea that you can just make a few small changes and radically improve your conversion rate.
But to make any real progress, you need to take a step back and diagnose what’s actually wrong with your site first. Heatmaps and sessions recordings, used in conjunction with other website analytics tools like Google Analytics, are the best way to do that.
To help you improve your website and get more conversions, we share how to use Google Analytics with Crazy Egg’s heatmap reports to easily identify and fix 3 of the most common problems:
Note: Ready to uncover your visitors’ click behavior, plus how you can optimize your website for more conversions? Sign up and try Crazy Egg free for 30 days.
How to Diagnose Website Problems via Heatmap
There’s one fundamental problem that most often leads marketers to re-examine their website: a low conversion rate. If the website overall isn’t converting at a high enough rate, it’s usually a good clue that you need to look into things.
Step 1: Map Your Ideal Conversion Path
For many marketers that means digging into individual web pages that show a low conversion rate. The problem with that approach is that conversion is a journey—and leads don’t go from zero to 100 by looking at one landing page.
“The problem manifests itself in a variety of ways,” our Conversion Rate Expert JL Neilsen explained. “The friction point causing poor conversion may be at the start of the funnel, somewhere in between, or on the last step. The key is to track the journey.”
That’s why diagnosing website problems means looking at the entire buyer’s journey and identifying where visitors diverge from the buyer’s journey you have in mind for them.
Step 2: Look at the Path Users Are Actually Taking and Identify Friction Points
Once you know how you want users to move through your site, you can use Google Analytics’ ‘Behavior Flow’ report to see how they’re actually moving.

Behavior Flow can show you the overall path users are taking through your website. It can also help you identify common drop-off pages where users either leave the site or diverge from the path you’ve set out for them.
For example, you may find that a particular landing page is causing a lot of drop-off. That may mean the page isn’t well optimized for conversion. But it could also mean that the ad copy leading users to that page isn’t attracting the right users or setting accurate expectations for what they’ll find on the landing page.
Step 3: Run Heatmap — and Other Tests — to Get to the Heart of the Problem
Wherever the typical user flow diverges from your ideal path, that represents a good page for running additional tests, including heatmaps and session recordings. Now, when you look at the heatmap report for that page, you can interpret it within the context of your specific goal for that page and where it sits within the overall journey.

Heatmaps illustrate the frequency of click behavior on different portions of a web page.
Your heatmap report can then tell you where users’ actual click behavior diverges from that journey—and help you identify why.
If you’re using Crazy Egg for heatmapping, you can use additional reports (including the Scrollmap, Confetti, Overlay, and List Reports) to dig into the data even further. For users who don’t follow the ideal path, you can answer key questions like:
- Where are they coming from (by referral source)?
- Are they based in a common geographic region or country?
- Do they include existing customers (who are logged into their accounts)?
- Have they been to your website before or are they new users?
- Are they accessing your site from a particular device or operating system (OS)?
- What search terms are they using that lead them to your site?

The Confetti Report breaks down click behavior by 22 dimensions, including referring source.
“All this information will help identify the friction points,” JL said. “Once you find the friction points, you can start to understand why they’re happening and brainstorm ideas for how to fix them.”
Using our example from above, if your ad copy is the problem, you’d see very few clicks from users who came from that particular PPC campaign. On the flipside, you may find that it’s users accessing your site from mobile devices that exit the page at a high rate—which tells you there could be a design or functionality issue on the mobile version of that page.
Note: Ready to uncover your visitors’ click behavior, plus how you can optimize your website for more conversions? Sign up and try Crazy Egg free for 30 days.
Once you’ve directly identified the problem with your conversion funnel and the individual pages causing friction, now you’re ready to attack the problem and improve your conversion rate.
Problem #1: Low Clickthrough Rate (CTR) on Calls-to-Action (CTAs)
Low clickthrough rate on CTAs is easily the most common problem we hear about from our customers’ websites. In short, it means you’re getting people to the landing page, but they aren’t clicking where you want them to.
How to Identify It
When you look at a heatmap report for your landing page, you ideally want to see yellow or white on your CTA. If you’re seeing blue or no color at all, that tells you very few people are clicking on that element.

In this screenshot, we can see that the CTA button isn’t getting many clicks.
How to Fix It
Before you can fix low CTR on your calls-to-action, you need to understand the underlying cause. Why aren’t people clicking?
- First, take a look at your Confetti Report to see if any of the dimensions can explain low CTR. For example, you might find that CTR is particularly low for referral traffic but it’s higher for email and SEO traffic.
- If you can’t find a cause there, take a look at your Scrollmap Report. This report can help you see if your CTA is located farther down the page than most people scroll. If that’s the case, the solution can be as simple as moving it up higher on the page.

- If scroll depth isn’t the problem either, you can begin testing changes to the CTA itself. Test different copy, color, design, and placement—then run “after” heatmaps to see how those changes affect click behavior for your CTA.

Here’s the “after” heatmap for the screenshot from before. Changes to the button copy increased click frequency on the CTA.
Problem #2: Low Completion Rate on Forms
When visitors begin to fill out a form on your website, but they don’t end up finishing or submitting it, you’ll see a low form completion rate. That indicates a problem with the form itself. They were compelled enough to get started, but something stopped them from finishing.
How to Identify It
When you look at your Overlay Report for the page, you’ll see a (+) button for each form field where users can click to add their information. By expanding it, you can see the number of people who start the form—and click in each field. Then you can weigh that number against how many users complete or submit the form.

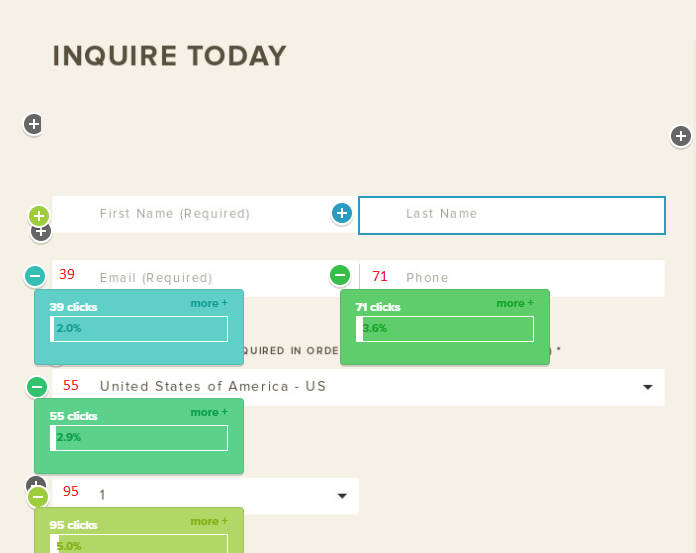
In the Overlay Report above, we can see that more people were willing to share their phone number than their last name.
How to Fix It
The primary reason website visitors start filling out a form but don’t finish is that the form asks for more information than the visitor wants to fill out. That may be because the form is too long or involved, or it could mean that visitors don’t feel they’re getting enough value in return.
So there are two main solutions you should test:
- Consider what information you really need from leads, then cut as much as you can from the form. The less information you ask for, and the fewer fields to fill out, the less friction stands between users and conversion.
- Offer something of value in exchange for the information. This is the typical gated content approach. If you offer something your users value (say, an educational guide, for example), they have more incentive to complete the form and convert.
Once you’ve made one or both of these changes, you can regularly run successive Overlay Reports to monitor how the changes affect form completion rate.
Problem #3: High Exit Rate
When visitors exit a page by leaving your website entirely, that’s known as their “exit page”—in other words, the last page they view in a given session. When a page has a particularly high exit rate, it can indicate that you aren’t giving users a clear (or compelling enough) next step to stay within your ecosystem.
How to Identify It
In your Google Analytics account, navigate to Behavior > Site Content > Exit Pages. Here, you’ll see an overview of total exits across your set timespan and a breakdown of the number of exits and the exit rate for each page of your website.

How to Fix It
High exit rates can be caused by several different issues, so identifying the underlying issue is the first step. There are a few different ways to approach the problem using heatmaps:
- The traditional heatmap report can show you if users are clicking elsewhere and getting distracted. For example, if your content has third-party ads on it, visitors may be exiting your site by clicking on those ads.
- To get even more specific, our List Report can explain where those people are going—by listing every URL visitors go to after leaving a given landing page.

Once you have a sense of where people are going when they exit your page, it’s easier to see the areas where you can make changes to alter that behavior.
For example, if users are clicking on external links in your blog posts and exiting the website from there, you can consider setting those links to open in a new tab or window—so users aren’t interrupted or redirected before they finish reading the post.
Improve Your Website Intelligently
Building a better website—one with a higher conversion rate, lower exit rate, and more completed forms—isn’t about throwing a bunch of half-baked solutions at the wall and hoping for the best.
By taking a step back and analyzing your problem landing pages within the context of your ideal user journey, you can take more informed (and effective) steps toward improving your website overall.
Getting these data-driven insights to improve your website doesn’t have to be difficult or time-consuming. Using Crazy Egg, you can easily figure out what to do next.
If that sounds like just what you’ve been looking for, come give us a try. We offer a 30-day trial, completely free, that works on any of our pricing plans.