A heatmap is an extremely valuable tool for anyone with a website.
Heatmaps are a visual representation of crucial website data. With just a simple image, you’ll be able to determine what’s working with your website and what needs improvement.
One of the best parts about using a heatmap is that you won’t have to wade through an overload of numbers or spend time trying to decipher complex spreadsheets. Heatmaps are simple. Every boss, client, or anyone, for that matter, can understand the results.
With heatmap reports, you’ll have a clear depiction of how visitors are interacting with your website.
After you determine where people are focusing the majority of their attention on your site, you can use that information to optimize conversions. Whether it’s removing distractions from a page that could be hindering your conversion rates or moving a CTA button, heatmaps improve CRO with data-driven visual reports.
Creating a heatmap is easy. In fact, you can create one online in less than 15 minutes—for free.
For those of you who have never done this before or just need some extra guidance, I’ll walk you through the step-by-step process for creating a heatmap.
Step #1 — Create a Crazy Egg Account
There are a handful of reputable heatmap tools on the web, but Crazy Egg will be your best option. This is especially true for those of you who want to create a heatmap for free.
More than 300,000 companies trust Crazy Egg for heatmap reports, including global brands like Dell, Yahoo, Etsy, Intuit Mint, Optimizely, and Twillo.
Signing up for a Crazy Egg account is simple. Just enter your email address and create a password. You can even sign up using your Google account with just one click.
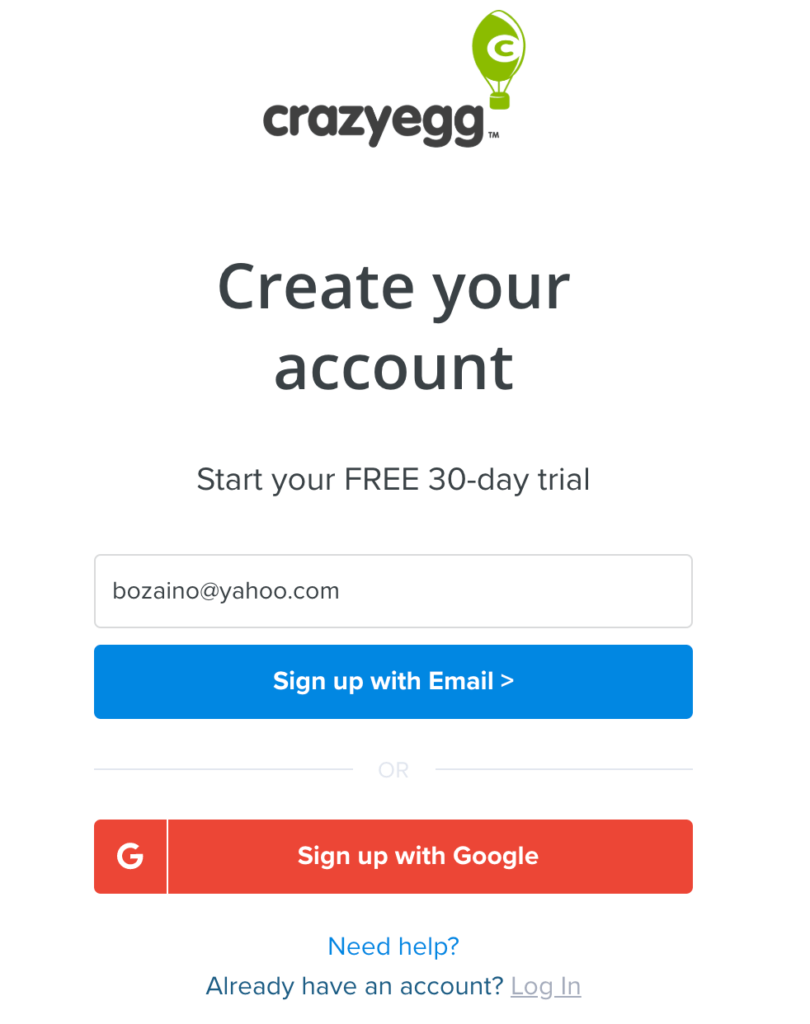
Every new Crazy Egg plan comes with a free 30-day trial. This is more than enough time to create as many heatmaps as you need and test the tool before you decide to commit.
After you create an account, you’ll be asked to choose a plan. The plans are based on monthly tracked pageviews, monthly recordings, and storage.
The entry-level plan starts at 30,000 pageviews, 100 recordings, and three months of storage. The top-tier option goes up to 500,000 pageviews, 5,000 recordings, and two years of storage. There’s even a custom plan for anyone who needs more than this.
Select whichever option aligns closest to your monthly site traffic.
Step #2 — Install the Tracking Script
After you’ve created an account, Crazy Egg will prompt you to install a tracking script on your website. This code will connect with Crazy Egg, allowing the tool to collect data from your site.
There are a few different ways to install the tracking script. Here’s what the screen will look like when you get to this stage:
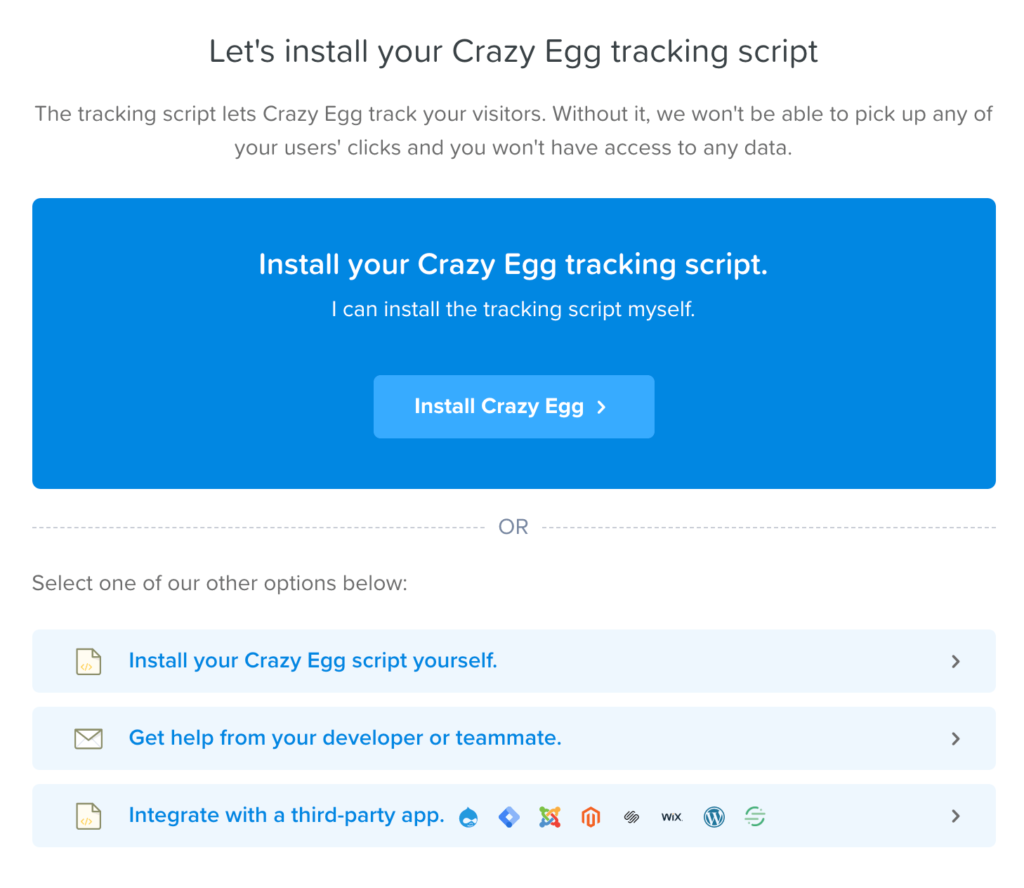
These are the three ways to install your tracking code:
- Do it yourself.
- Have your developer (or someone else on your team) do it.
- Integrate with a third-party app.
All three options are very straightforward. It all depends on your comfort level and technical knowledge. But even if you have no development experience, you could easily install this on your own. For those of you who are more comfortable sending it off to your developer, that’s fine.
I’ll give you a quick breakdown of each option so you can decide what’s best for you.
Install the Tracking Code Yourself
If you decide on the first option, you’ll be brought to a screen that looks like this:
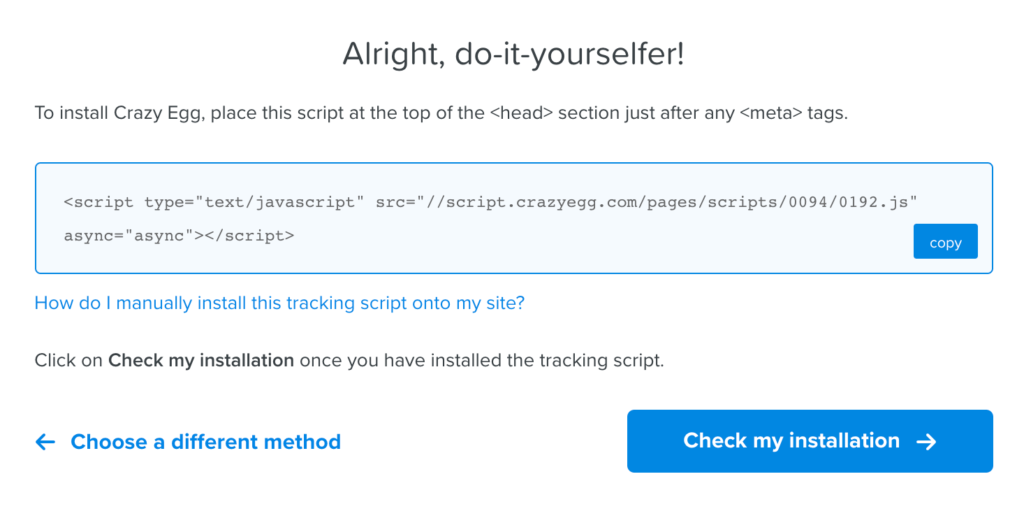
Crazy Egg will automatically generate a tracking code. Simply copy the code and paste it into the <head> section of your website after your <meta> tags.
Here’s an example of what that tracking script will look like after it’s been installed on your website.
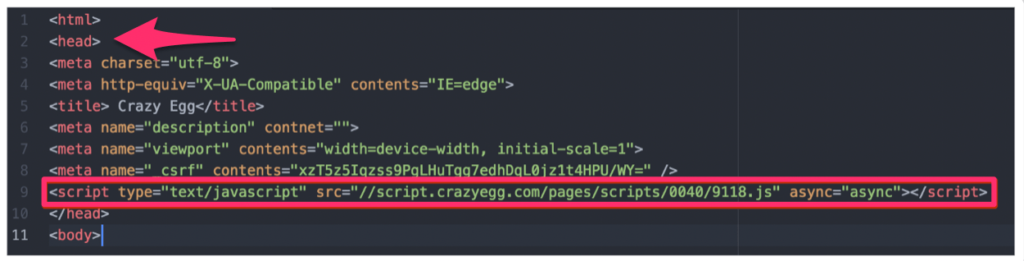
As you can see, I pasted this in the last line of the head section after the meta tags. If you know how to find and edit the HTML code on your site, this method is simple and straightforward.
Then go back to Crazy Egg and click “Check my installation” to verify that it’s been installed properly.
Have a Developer Install the Code
If you’re not comfortable doing this manually on your own, or you’d rather have your developer do it, you can send them a simple email with all of the instructions they need.
Just click on the second option, and fill out the following details:
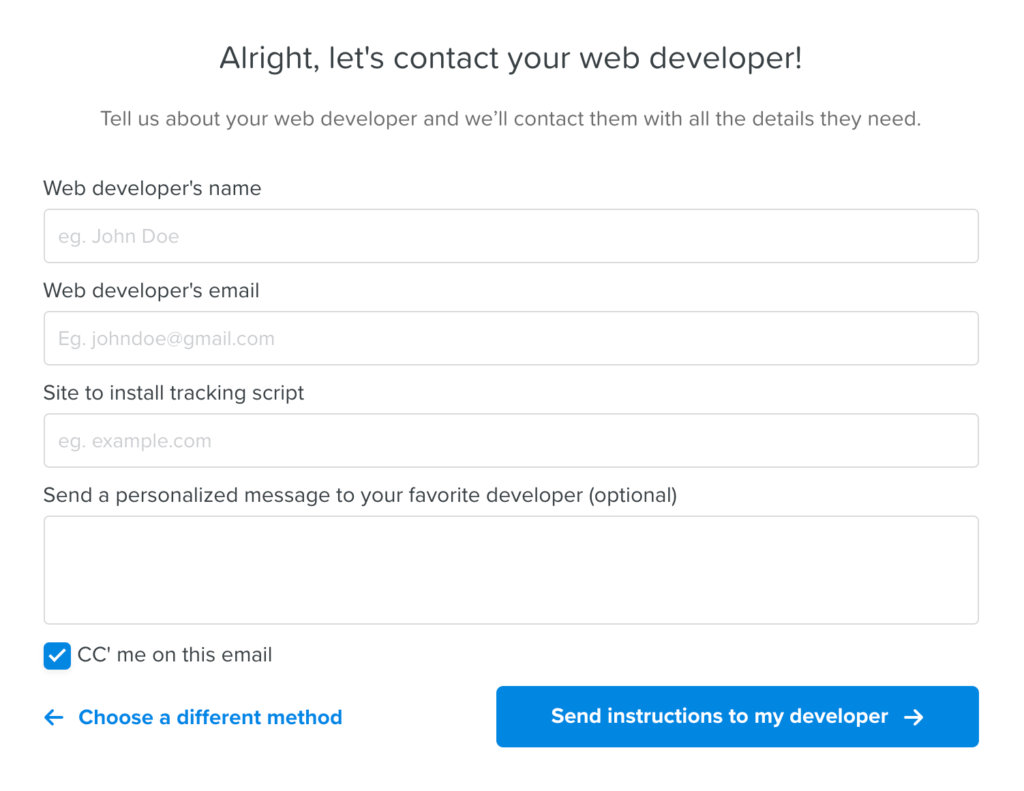
This process will be straightforward for any developer. They’ll have the tracking script installed to your site in less than 60 seconds.
Integrate With a Third-Party App
Another simple way to install the tracking script on your website is by integrating with the CMS platform you’re using to manage your website.
Just select an app from the list to continue:
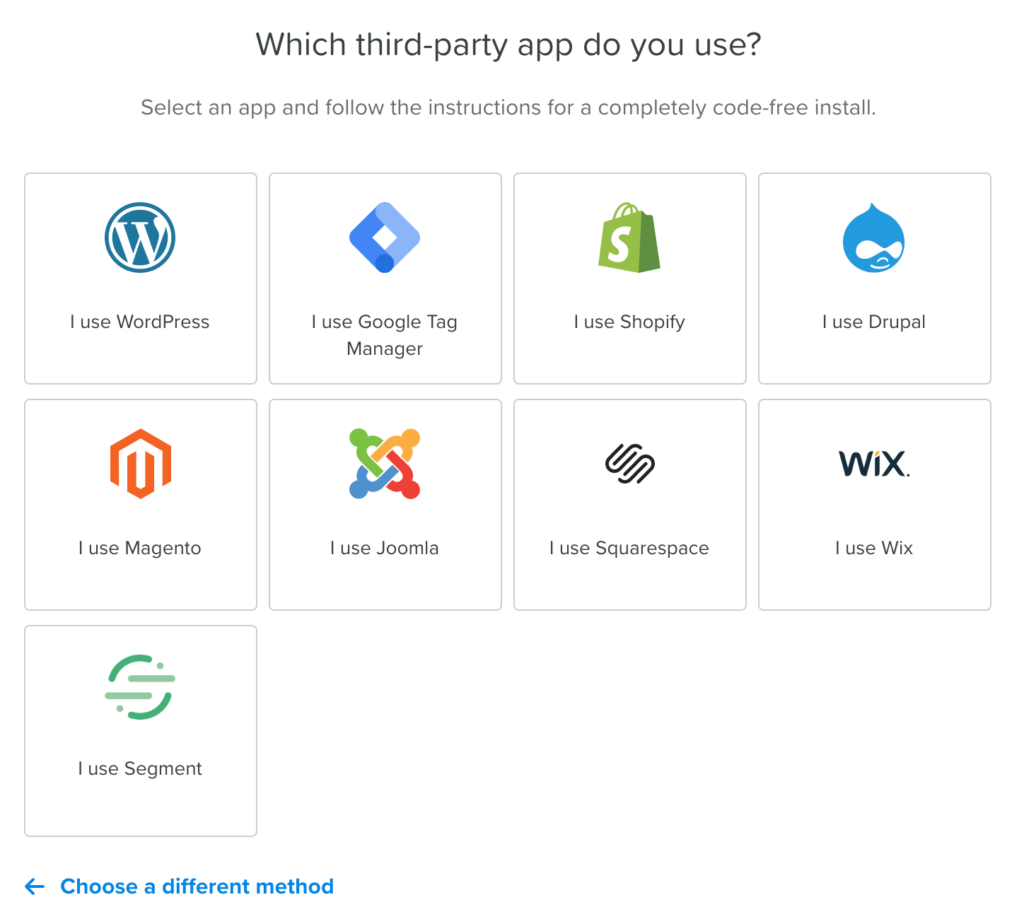
The instructions will vary slightly based on the platform for you’re using. Regardless of what you click, Crazy Egg will automatically show you the step-by-step instructions for a code-free installation.
For example, if you’re using WordPress, the instructions will walk you through adding the Crazy Egg plugin from your WordPress dashboard. Squarespace requires you to change some of your advanced settings. Shopify directs you to the app store. Wix sends you to its marketing integrations page.
No matter what platform you’re using, the app integration process should take a few minutes at most to set up. You won’t have to touch the HTML code of your site if you go this route.
Step #3 — Create a Snapshot
Once the tracking script has been installed, you’ll be ready to create your first snapshot. A snapshot gives you access to five different data reports—heatmap, scrollmap, confetti, overlay, and list.
For the purposes of this tutorial, we’ll focus on the heatmap report.
First, decide if you want to create one snapshot or multiple snapshots. Most people choose the latter of the two, but one is fine for now if it’s your first time and you’re still getting your feet wet.
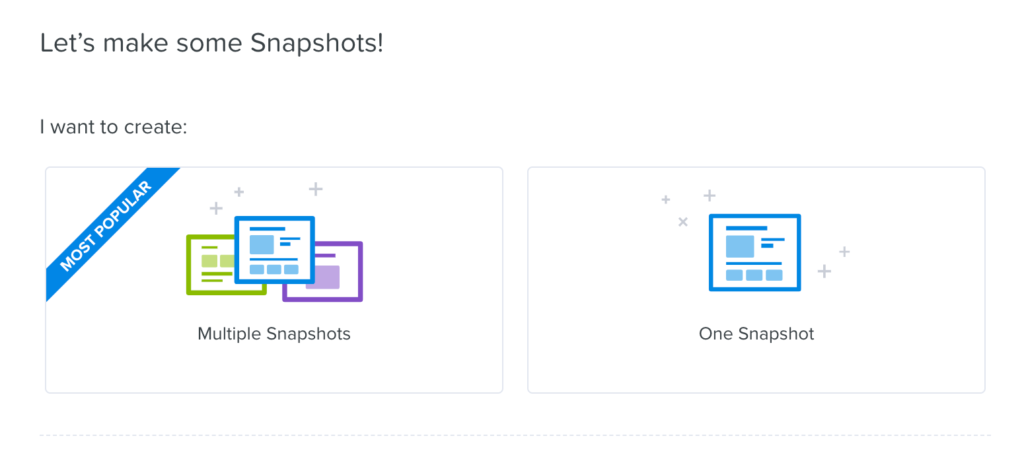
For our purposes here today, I’ll go through the process of creating one snapshot, so you have a firm grasp of how to set this up.
Crazy Egg walks you through each step with easy to follow form fields. Start by entering the URL of the page you want to create a heatmap for. Then name the snapshot (homepage, pricing page, FAQ page, etc.) and choose your reason for creating it.
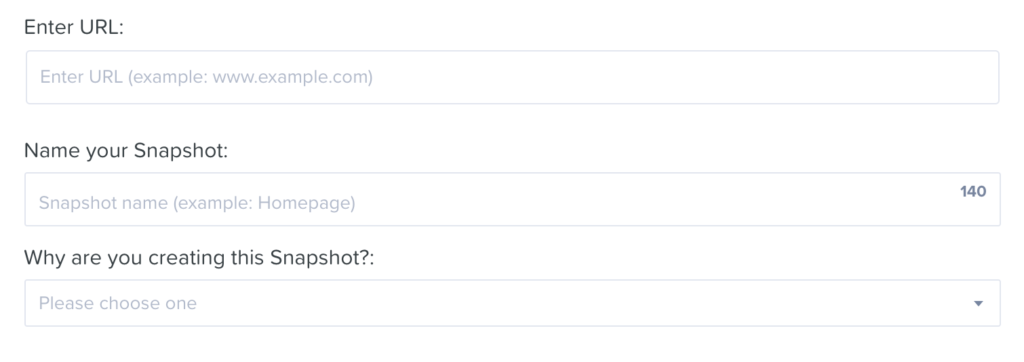
These are the reasons you have for creating a snapshot:
- Launching a page for the first time
- Redesigning an existing page
- Establish a baseline for ongoing monitoring
- Inspiration for new ideas
- Unsure
After you fill out these three quick form fields, determine which devices you want to create snapshots for. By default, you’ll get a snapshot for desktop, tablet, and mobile devices.
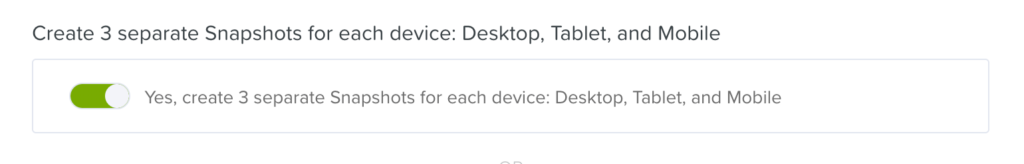
I recommend keeping this enabled. But if you toggle it off, you can track the snapshots and traffic for specific devices only.
Next, you’ll determine when you want the snapshot to start and end.
You can start it immediately or begin at a scheduled date and time. By default, the snapshot will end in 60 days from the start date or once the page gets 25,000 visits. But you can customize these settings to end the snapshot at a custom day and time or when the page reaches a specified number of visits.
There are other advanced settings you can customize as well. For example, you can change the sampling ratio. Instead of tracking every visit, you could track every one in five visits or one in ten visits. You can omit popups and set other custom URL tracking rules as well.
But for now, I’d recommend sticking with the default settings. There’s really no reason to mess around with this stuff right now, especially for your first snapshots.
Step #4 — Analyze Your Heatmap Data
The heatmap snapshots will provide you with valuable information related to your site’s design, copy, layout, and other factors that impact conversions.
Brighter areas of the visual report signify heat (hence the name). These are the most popular areas of the page. Darker areas of the screen are less popular. As certain areas of your page get more clicks, the colors on your heatmap will change.
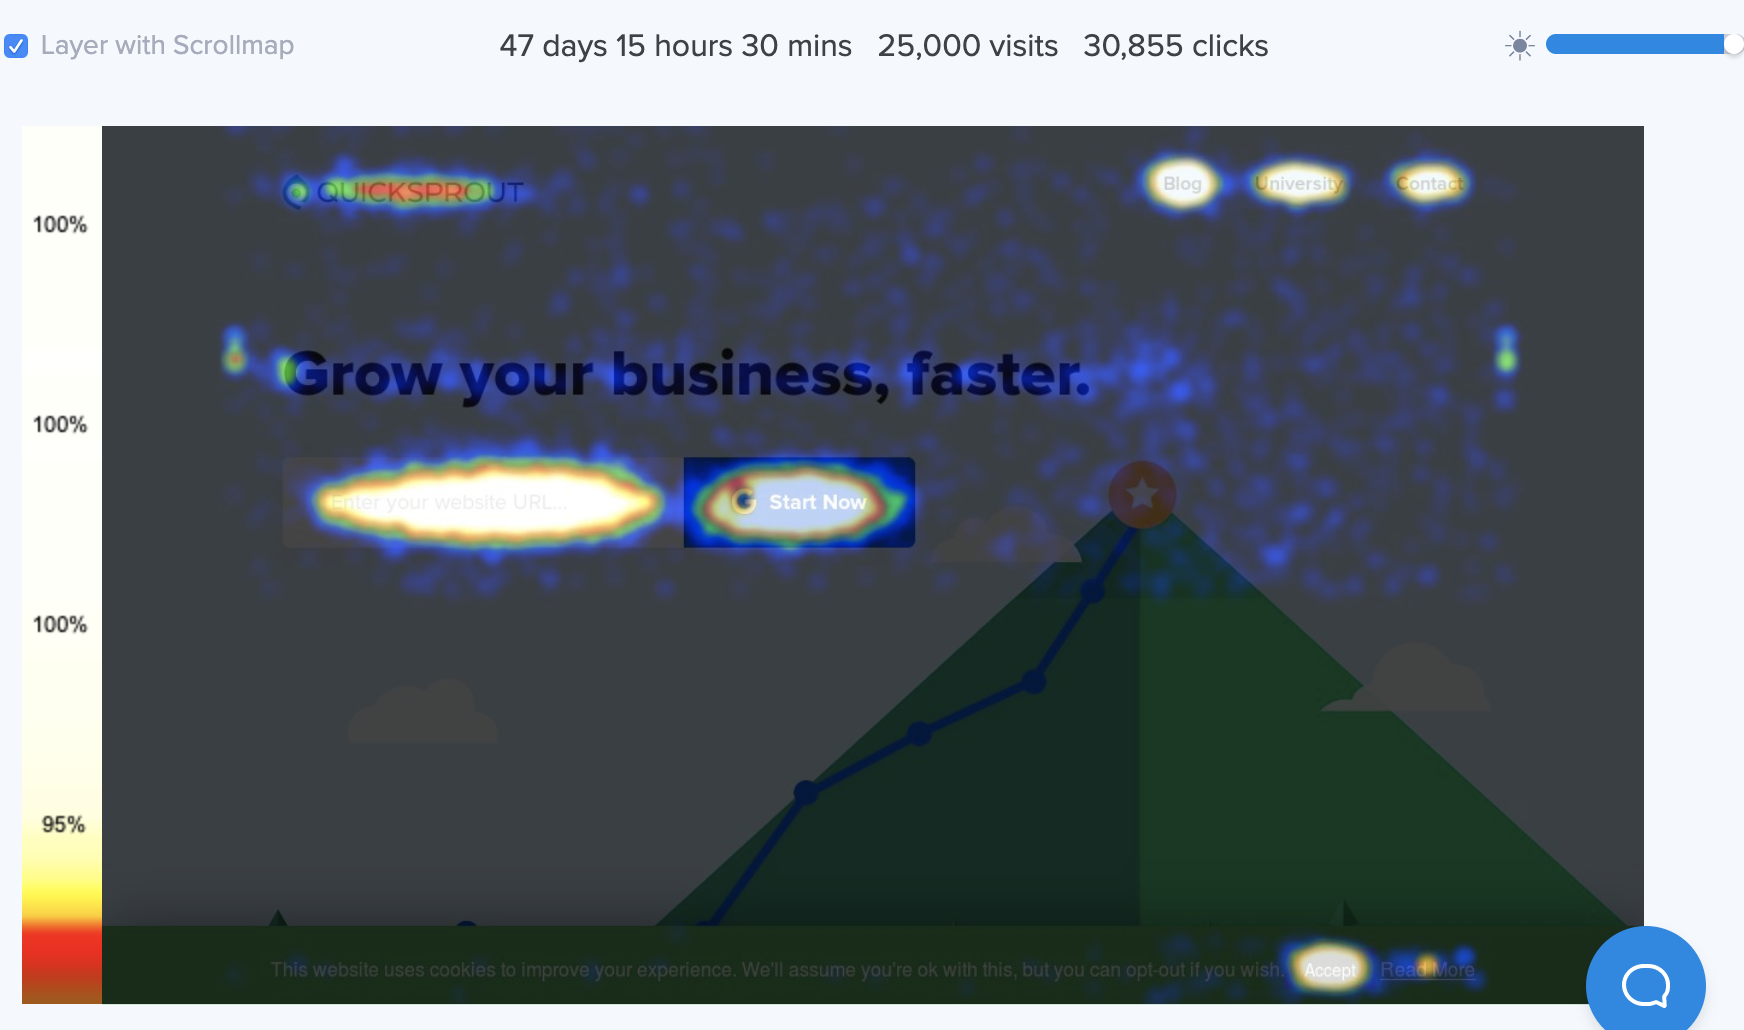
Here’s an example of what a completed heatmap report looks like:

If you look at the top of the screen, you’ll see that it took 47 days to reach 25,000 visits on this page. By default, this will complete the test. But you can change those settings based on your needs, as I described earlier.
There were 30,855 clicks tracked on this page during that time. As you can see, the bright spots are the hottest.
This heatmap report is layered with the scrollmap feature. That’s what the bar on the left side of the report is displaying. To remove this, simply uncheck the “layer with scrollmap” box on the top left side of the screen.
I like to keep the scrollmap enabled when I’m viewing a heatmap report. These two visuals provide valuable information when they are used in parallel.
For example, you determine areas of the page where users are scrolling, but not clicking. This would be the perfect place to either add a new CTA or change the one that’s there and not working. You’ll be able to target different types of users based on their level of engagement. So the CTA for users who make it halfway down a page can be different from the CTA at the top of the page.
You can also adjust the contrast of the report with the slider bar on the top right side of the page.
If certain areas of your pages have fewer clicks than others, you can experiment by adding new links, CTAs, or titles to those areas to draw more attention and conversions.
For those of you who just created a new heatmap and you’re waiting for data to analyze, you can play around with Crazy Egg demo in the meantime.
It’s also worth noting that you don’t have to wait until a report has been completed to view it. You can always check those in real-time by navigating to the “Snapshots” menu of your Crazy Egg dashboard, which can be found on the left side of the screen.
Step #5 — Make Changes Based on the Heatmap Results
Technically, your heatmap has already been created by this point. But it’s important for you to understand what to do with the data.
One standout of Crazy Egg compared to other heatmap tools on the market is that it has A/B testing built-in. So you won’t have to use a third-party app or platform to experiment with changes.
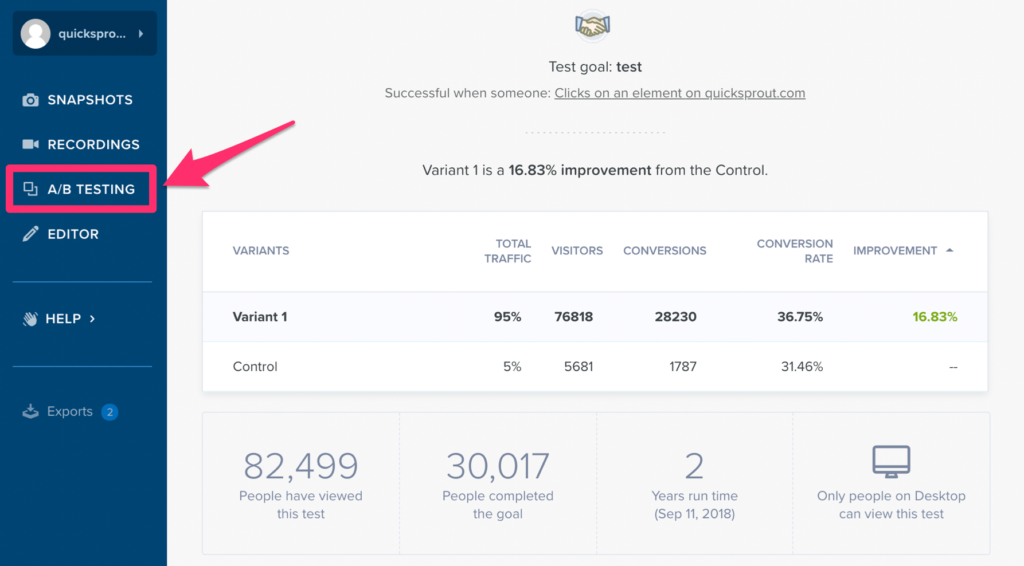
You should always take advantage of the A/B testing tool whenever you’re making new changes to your website. The data from the A/B test will tell you if your changes actually made a difference.
As you can see from the example report above, the variant page had a 16.83% improvement from the control page.
Just make sure you’re only testing one variant at a time. Otherwise, you won’t know which change caused the results.
This will be an ongoing process. Even after you’ve run one heatmap for a single page, there’s always room for improvement. That’s why A/B tests are so helpful.
You’ll also want to continue running different heatmap reports for other areas of your website beyond the initial report. As your website scales, you’ll always have new pages to analyze.
If you’ve been following along in this guide, you should have your first heatmap created by now. It hasn’t cost you a penny, and you’ve been able to do it at 15 minutes, at most. Waiting for the results of the report will take some time, depending on your settings.
Now you can go back and repeat this process for other pages on your website. You can even experiment with the ability to create multiple snapshots simultaneously, as I explained back in step #3.
If you weren’t following along, you can still sign up for a Crazy Egg free trial. Then use this guide as a reference to create your first heatmap.