There are a ton of SaaS metrics measuring sales efficiency, margins, revenue, and more. These are all important metrics (depending on the stage of your business) that you should be constantly monitoring in your SaaS organization.
But I have a gut feeling that we are missing an important metric around organizational efficiency. Something that will spotlight what, in my opinion, is a SaaS company’s most important asset. And that is the people.
Yes, we have revenue per FTE, but I feel that this ratio is too generic. Total revenue is just too vague. And using FTE’s (full-time equivalents) doesn’t zero in on true efficiencies and regional wage differences.
In this post, I present a new SaaS metric to better measure your financial performance as it relates to your employees and contractors.
ROSE Metric
I would like to introduce a new SaaS metric that goes deeper than revenue per FTE. I’m calling this new SaaS metric the Return on SaaS Employees, or the ROSE metric. Catchy, right?
Yes, I am a CFO who takes a hard look at expenses, but, no, this metric is not meant to slim down your workforce to improve your organizational efficiency. Exactly the opposite as I will explain later.
It is intended to highlight the tradeoffs between headcount, recurring revenue, and EBITDA growth. And when your budgeting or planning season approaches, I want us all in SaaS to take a hard look at the investment that we are making into our people.
How to Calculate the Return on SaaS Employees (ROSE)
The ROSE metric requires revenue, expense, and headcount inputs. Data that you should have readily available in your P&L and headcount reports. You will optimally want two to three years of monthly data, so that you can visualize a nice trend in the data.
What exact numbers do I need to be pulling for this metric? I explain the formula inputs in detail below.
Recurring Revenue = the sum of your recognized subscription revenue over a specific time period. Do not include services or other one-time revenue. You may also include variable revenue (usage, transaction, etc.) in the numerator. Proper revenue recognition should be in place for your subscription revenue. Do not use invoiced revenue (cash basis) that is hitting your SaaS P&L. The metric won’t work. Please see my post on proper revenue recognition and deferred revenue if this is your situation.
Employee Related Expenses = wages, payroll taxes, benefits, retirement plan costs (i.e. 401K match), commissions, stock compensation, and bonuses. Any expense directly tied to the compensation of your employees.
Contractor Expenses – direct payments to full-time an part-time contractors that help you on a consistent basis. I’d exclude consultants and one-time projects.
Headcount = full-time equivalent (FTE) employees in your SaaS business. You will chart this. As an aside, headcount should be pulled from your payroll system and tracked on a monthly basis by department and by position type.
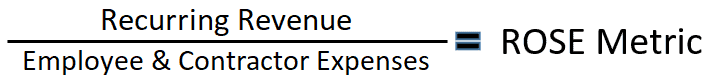
Plug your revenue and expense inputs into the formula above. This returns the amount of recurring revenue generated for one dollar of employee related expense. The FTE number will be charted against your ROSE metric so that you can see how the two lines correlate (or don’t correlate).
ROSE Metric Survey
The power is in the data. I’d like to benchmark the ROSE Metric and then publish the results in a future newsletter. Please take a moment to gather your recurring revenue data and employee/contractor expenses and submit it in the survey below.
Take the survey here (just a couple minutes)!
I’ll give away my SaaS Pitch Deck templates to random participants.
ROSE Metric Example
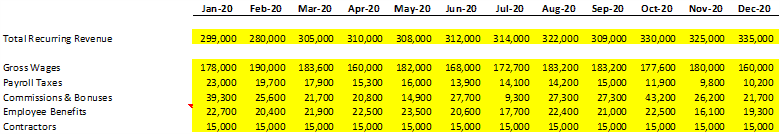
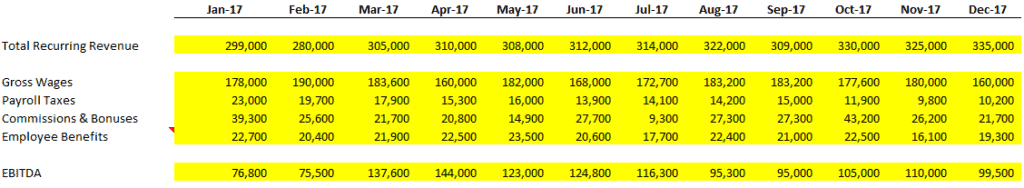
Let’s create an example SaaS company (ABC Co.) with 25 to 30 employees and $300K in MRR. Based on the sample dataset below, we can calculate the ROSE metric.
The Excel template can be downloaded below to follow along.
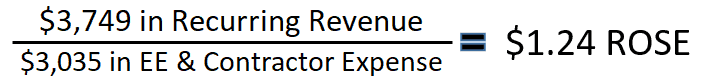
For the year 2020, I summed the recurring revenue ($3,749K) and divided by the five rows of employee and contractor expenses ($3,035K).
In my example, ABC Co generates $1.24 of recurring revenue for every dollar of employee expense.
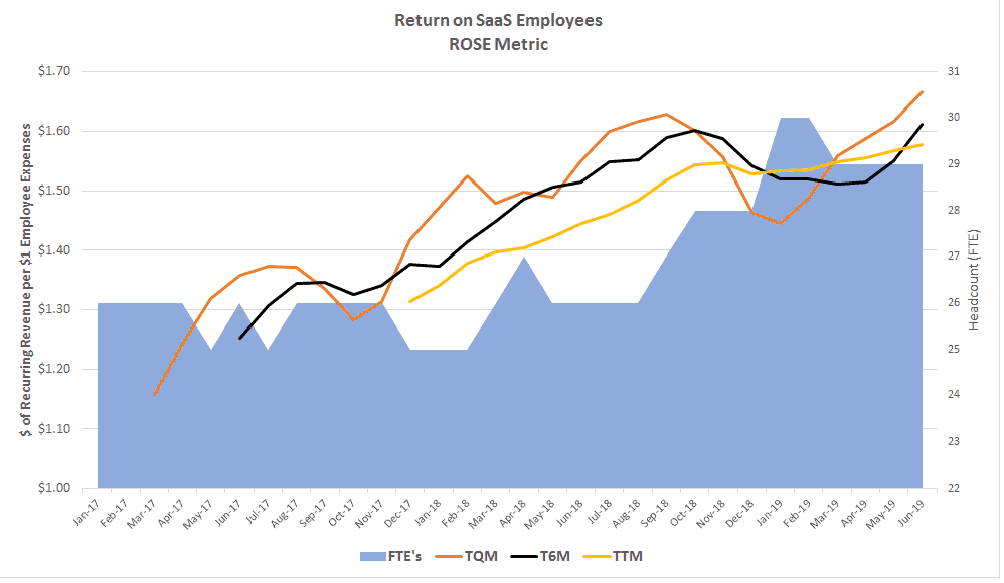
The data becomes more interesting when you trend it over time. I calculated the ROSE metric on the trailing three months, trailing six months, and trailing twelve months.
On the secondary vertical axis, I plotted employee headcount. This is the solid blue area.
In the chart below, this is the trend that you would want to see. Despite increasing headcount (from 26 to 29, and a high of 31), the employees of ABC Co are improving the recurring revenue output for every one dollar of employee and contractor expense.
Per the trailing six-month line (black line), ABC Co increased from a $1.25 to a $1.61 (recurring revenue generated for every dollar of employee investment) even with a growing employee count.
Investment in Your People
Finally, let’s think about the investment in our people beyond traditional benefits such as health and retirement plans. Those are important and significant benefits and as a CFO, I assess these each year.
But what about direct training investment in our employees? What are our plans or budget for educational conferences, online training, certifications, and classroom training? I challenge you to count the line items in your forecast, budget, or informal plans for direct employee training investment.
We expect improved growth in recurring revenue and EBITDA, but what investments are we making in our most important asset to deliver these outsized returns? Training is easily slashed in the budgeting or planning process, but I believe employee training deserves more respect when prioritizing discretionary expenses.
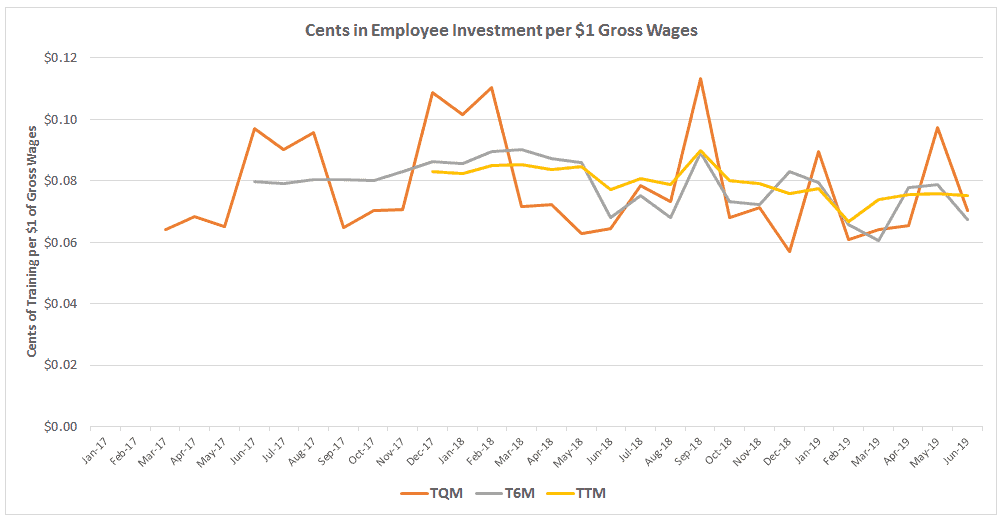
In the chart below, I calculate the cents of employee investment for every one dollar in gross wages. I won’t get into the calculation here, but you can download the template below and try this calculation for your company.
Action Items
The objective of this post is to create awareness about the largest and most important asset in your company – people. We think hard about what and how many positions that we need in our organization.
Once the position is filled, we move on to the next open or new position. Let’s extend that thinking to the investment needed for our colleagues to grow.
Download the template below and input your numbers. I would love to hear your comments. Does the ROSE metric resonate with you? Please comment below.
Advanced ROSE Metric
The main post stops above but continue reading for more on the ROSE metric.
Return on Employee EBITDA (ROEE) – Growth vs. Profit
In the ROSE metric chart above, it’s great that we are efficient in generating more recurring revenue for every dollar of employee investment. The ROSE metric focuses on the top of the P&L. However, with revenue on the top of the P&L, there is also profit or loss at the bottom of the P&L.
And, typically, with any SaaS metric, the numbers are more meaningful in relation to other metrics. This leads us to the next logical question.
As we grow our recurring revenue, are we still efficient in growing our EBITDA? Or are we sacrificing growth for profit? This section may not be as relevant if you are a startup or your strategic initiative is to reinvest all profits back into growth. However, it is good to consider the tipping point where you must balance growth and profit.
The second step in this analysis is examining the tradeoff between recurring revenue and profit. For profit, I will use EBITDA (earnings before interest, taxes, depreciation, and amortization).
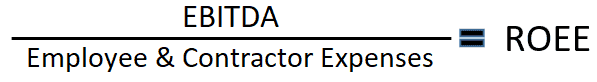
How to Calculate ROEE
The ROEE metric uses the same data as above, but we replace recurring revenue in the numerator with EBITDA. The result equals $X dollars of EBITDA for one dollar of employee investment.
The point with this metric is to measure how efficient your organization is in generating EBITDA relative to employee investment. And, again, employee wages and related expenses are most likely the largest expense category on your P&L, and, hence, the focus.
ROEE Metric Inputs
EBITDA = earnings before interest, taxes, depreciation, and amortization.
Employee Related Expenses = wages, payroll taxes, benefits, commissions, stock compensation, and bonuses. Any expense directly tied to the compensation of your employees.
Contractor Expenses – direct payments to full-time an part-time contractors that help you on a consistent basis. I’d exclude consultants and one-time projects.
The result is $X dollars of EBITDA returned for one dollar of employee and contractor investment.
ROEE Metric Example
We will use the same data as above, but now we add EBITDA to our spreadsheet.
For the year 2017, I summed the EBITDA ($1,303K) and divided by the four rows of employee expenses ($2,845K). In this example, ABC Co generates $0.46 of EBITDA for one dollar of employee expense.
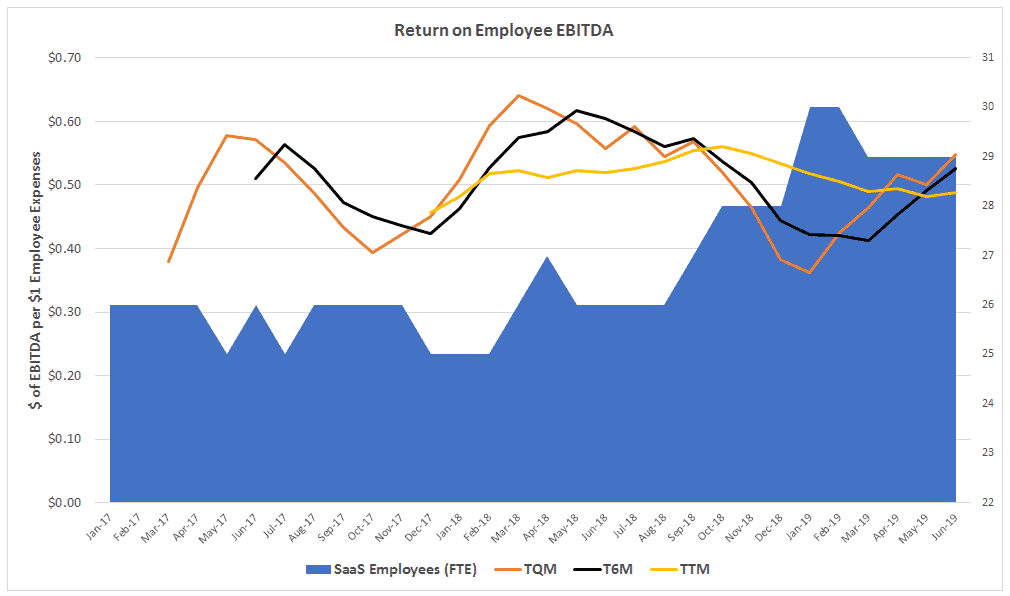
When we plot ROEE below, you can see that the ROEE is hovering around the $0.50 line. EBITDA is not as easy to scale up and to the right like revenue, but, in this example, we are maintaining our ROEE efficiency over the measured time period.
With our recurring revenue growth above, we are maintaining our ROEE efficiency. As recurring revenue grows, our EBITDA volume (more dollars, not necessarily margin %) grows.
I have worked in finance and accounting for 25+ years. I’ve been a SaaS CFO for 8+ years and began my career in the FP&A function. I hold an active Tennessee CPA license and earned my undergraduate degree from the University of Colorado at Boulder and MBA from the University of Iowa. I offer coaching, fractional CFO services, and SaaS finance courses.
I really like these metrics and am now working on applying this process to my company. I’m analyzing our numbers and am curious as to what you’d expect to see as an industry average or standard.
Hey Ben, thanks for the great blog post. One question about the calculation. would you include contractors (freelance developers for instance) in the FTE calculation?
Hi Niels,
Great question. Yes, I would include contractors as well if that is material spend for you.
Ben