Deal-Level Intelligence You Can’t Get Anywhere Else
Revenue leaders have spoken. When it comes to forecasting, pipeline reviews, coaching and overall opportunity management — high-level predictions and scores simply aren’t enough. That’s why we’ve gone a step further (actually a whole flight and counting) to deliver the deep, real-time visibility and insights that make it easier than ever to inspect, predict, validate and coach effectively at every stage of the funnel.
Our goal at InsightSquared is to put you in control of every stage of the revenue process. We empower your team with answers to every revenue question and deliver answers quickly and effectively.
There’s a lot to be excited about in our Q1 Product Updates, including: Activity-by-Day, Extended Reporting for Custom Content Types, Goals for Everything, 120 Best Practice Dashboards and Expanded Conversation Intelligence.
These updates mean faster time to value for your entire revenue team. Let’s dive in.
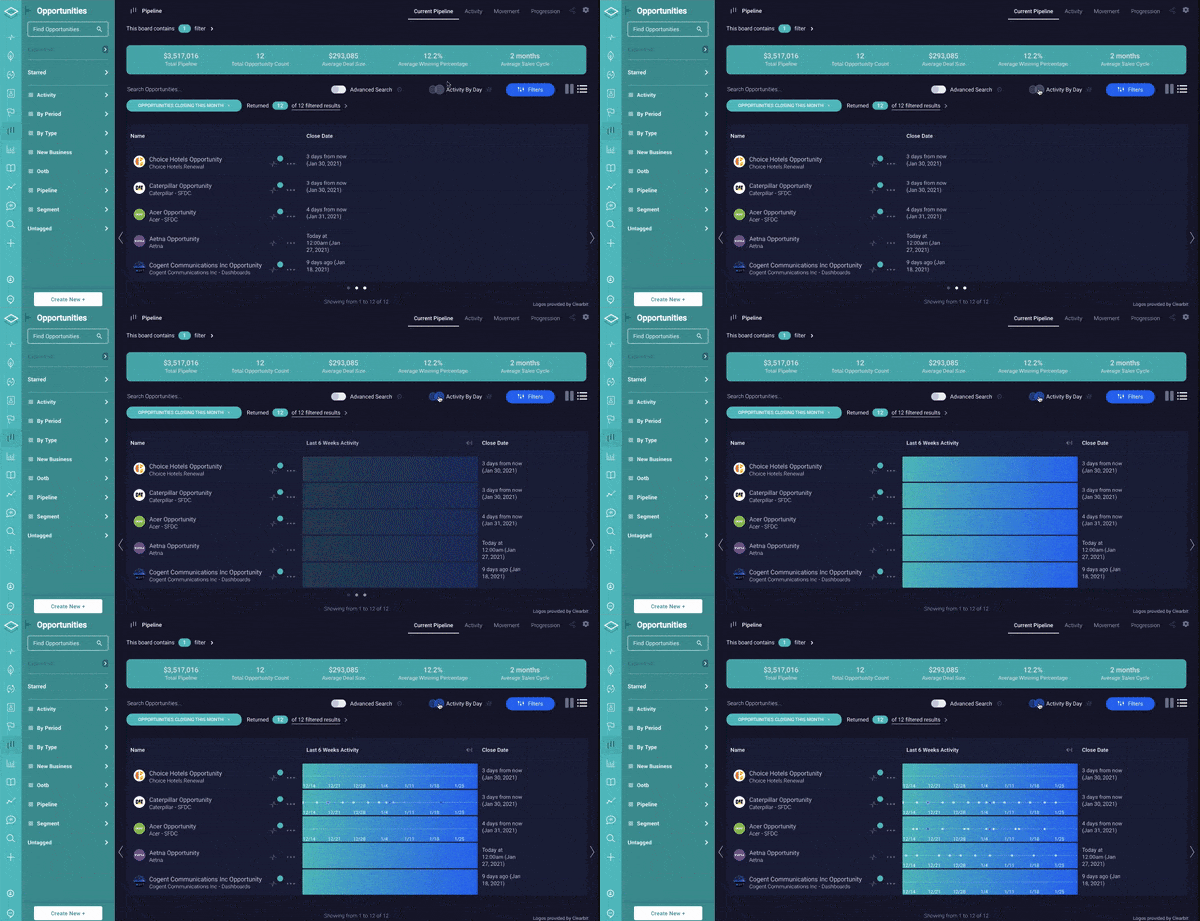
Get Analytics Side-by-Side with Detailed Activity
Activity-by-Day shows the last six weeks of activity and engagement for each opportunity. It’s a must-have for any rep 1:1, forecast review or pipeline inspection meeting, providing a clear visual into the engagement level to evaluate the true health of a deal. Use Activity-by-Day to answer questions such as:
- What kind of engagement and activity have each of my reps had with prospects? Are my SDR/BDR’s and reps engaging actively in the top of funnel opportunities? Simply click the People feature, enable Activity-by-Day, and you’ll have an instant visual of activity by rep, showing levels of both inbound and outbound activities of each rep over the last six weeks. You can also use filters to further drill down on the dataset you want to inspect without losing the Activity-by-Day column that’s been turned on.
- What level of engagement and activity is occurring on deals scheduled to close this quarter? Do I have the right level of engagement activity on the at-risk deals? My team’s commit decreased, what deals were adjusted and why? Check out the new “Closing this Quarter” pipeline card. Activity-by-Day will provide a visualization of engagement level for all opportunities closing this quarter and immediately identify the at-risk deals.
Notice a deal has gone quiet or the total ACV declined? Instead of being left hanging with more questions, we’ve intentionally designed Activity-by-Day so you can view the previous 100 individual activities side-by-side — drilling into the detail of each — to inspect. Now you know not just the “what,” but the “why” and “how.”
Activity-by-Day is the fast path to assessing engagement and identifying which deals need attention.
Unlock Goals For Everything, and We Mean Everything!
When it comes to predicting revenue growth and scaling sales execution, setting and tracking against goals is key. That’s why we’ve made it easy. Now you can set Goals for any metric. That’s right, Account-Level Goals, Meetings per Week, Engagement Goals, Competitive Goals, the list goes on….
Want to look at it by team, rep or by stage or business segment? As with all of our reports and dashboards, you can filter in real-time to get the views and answers you are looking for. And of course, drill into the detail for every deal, contact, person and more.
New Integration Alerts – InsightSquared Conversation Intelligence.
In Fall 2020 we introduced Conversation Intelligence – call recording, transcription and analytics integrated directly in the InsightSquared Platform. This quarter we’ve extended our support to Microsoft Teams, Google Meet and Dialpad, in addition to Zoom Video, Outreach, Salesloft and HubSpot. If you’re not integrating your conversation analytics with forecast predictions and other pipeline assessments, you’re missing that single view of the truth.
Extended Reporting and Support for Salesforce Custom Content Types
You’ve created Custom Content types in Salesforce for a reason – shouldn’t you be able to report on and analyze them? From Opportunity Splits to Contract, Orders to Product Line Items, you can now leverage InsightSquared to inspect every status and change across your revenue team – regardless of record type – adding another opportunity to take control of your entire revenue journey.
Expanded Historical Reporting: Understand What Happened When
The top line number may be consistent, but the deals within your funnel have changed. We’re giving you the ability to dig into the details to answer questions such as:
- “How has my Confidence to Close Score changed for my pipeline expected to close this month?”
- “What happened to all the pipeline created last quarter?”
- “How did Jane’s deals progress?”
- “Where are they now?”
Operationalizing your sales process relies on understanding every change and the impact of each one. InsightSquared is taking Historical Reporting to a new level, delivering visibility into real-time movement in your pipeline. Easily understand key metrics such as the number of New Business opportunities that entered the pipeline over the last quarter—and where they are now.
This deep detail is crucial to confidently predicting and executing on the quarter.
Map Your Reporting to Your Retail Calendar.
Do you operate on a retail calendar to better compare fiscal months and years by making calendar segments more consistent? Whether a 4-4-5, 4-5-4 or 5-4-4, InsightSquared’s Retail Calendar functionality intentionally “loses” a day each year, which is later made up by adding a week to the calendar after 7 days (or more) to align the actual fiscal end date with your desired fiscal end date.
Best Practice Library Grows: Your Hub for Sales Process Effectiveness
It’s been a massive quarter for us here at InsightSquared, and we’re excited to deliver even more self-service insight into your customer journey. Our Best Practice report library now features 100+ reports that speed time to value and advance your team’s go-to-market effectiveness.
Whether you are forecasting, inspecting, validating or coaching, you can rely on InsightSquared to quickly get you the answers you need.


