
We all know that churn and retention are critical concepts to understand in SaaS. As customers churn each month, we track logo and dollar counts in our churn and retention reports. And we document the reasons why. This is an aggregate view of retention. Let me introduce SaaS cohort analysis.
Cohort analysis is an analytical framework that provides a more granular view of this same data. It gives us an understanding of the why, how, and when of our customer’s actions, which helps us take steps towards improving customer retention and customer lifetime value.
In this post, I will explain the basics of cohort analysis, segmented cohort analysis, and its importance to our SaaS businesses. You can also download my free SaaS cohort analysis Excel template below.
Download my cohort analysis templates at the button below.
What is a Cohort Analysis?
Per the Merriam-Webster definition, a cohort refers to a group of individuals having a statistical factor (such as age or class membership) in common in a demographic study.
In our SaaS perspective, a cohort refers to a subset of customers who share a common characteristic. This common characteristic is usually the date or month of customer acquisition (i.e., what I like to call “basic” cohort analysis). “Segmented” cohort analysis, which I will explain later in this post, uses additional characteristics (e.g., acquisition channel) to create cohorts.
In a cohort analysis, we study how the characteristics of a cohort change over time. This could be staying or leaving us, spending more or less with us (e.g., increasing/decreasing modules or users), and/or specific actions taken by the customer that make them successful or unsuccessful on our product.
How to Perform an Effective Cohort Analysis
Because cohort analysis can get complicated fast when you start diving into the numbers, I will attempt to explain the concept of cohort analysis by comparing it to the 7-step scientific method. Let’s dust of our science books and dive in.
I believe this 7-step framework is very similar to what we are trying to accomplish in a cohort analysis. I outline the steps below and how the SaaS perspective applies to this process.
7-step Scientific Method Applied to Cohort Analysis
Step 1 – Question: The “thing” we want to know.
- For example, why are our customers churning? What characteristics do they share? What characteristics do customers share when they are successful with us? What sources of customer acquisition relate to the highest customer LTV or retention?
Step 2 – Research: What information is already known?
- Anecdotal evidence lives everywhere within your company about customer retention. Maybe, even some hard analysis. We have some ideas about churn, retention, and the best performing go-to-market (GTM) channels. This internal knowledge is what will be testing in the next steps.
Step 3 – Hypothesis: Educated guess or prediction of the outcome
- In our tactical weekly meetings or strategic off-sites, we as a team are forming and iterating on our hypothesis about customer acquisition, retention, road maps to name a few.
Step 4 – Experiment: Test the hypothesis
- Whether we know it or not, we’re testing our hypothesis each month. This could be our belief that trade shows perform better than LinkedIn ads for efficient customer acquisition. It could be that specific customer success touch point two weeks post go-live. Through our research, we have formed assumptions on how to operate the business.
- By implementing a cohort analysis, we can observe the outcome of our hypotheses.
Step 5 – Observations: Data you collect during the experiment.
- This is the heart of cohort analysis and often the hardest when lacking customer data. Each month we record the new customers acquired and specific characteristics around each cohort that we feel are important in understanding customer behavior and long-term success. Basic cohort analysis buckets these customers by acquisition month and follows their progression over time. Segmented cohort analysis buckets these same customers by acquisition month but then buckets them again by an important characteristic such as acquisition channel (i.e. tradeshow or LinkedIn ad) and/or customer size.
Step 6 – Results/Conclusions: Determine if your hypothesis was correct.
- Are our research and hypothesis correct? With our newly collected data in step 5, we can validate or invalidate our hypothesis and improve our tactical operations and long-term strategy.
Step 7 – Communicate: Share your results.
- And, finally, communicate our results to our internal stakeholders who share a role in this process. Of course, this process is never done. We go back to step 1 and start over.
Basic Cohort Analysis – Customer Retention
I mentioned above two analyses, a basic cohort analysis and a segmented cohort analysis. The basic cohort analysis studies a subset of customers by acquisition month. I call it basic but collecting cohort data provides amazing insights.
In the example chart below, we document the number of customers acquired in Jan-XX, Feb-XX, and Mar-XX. We then follow this subset of customers through time. Each month we track the churned customers (and why) and the retained customers.
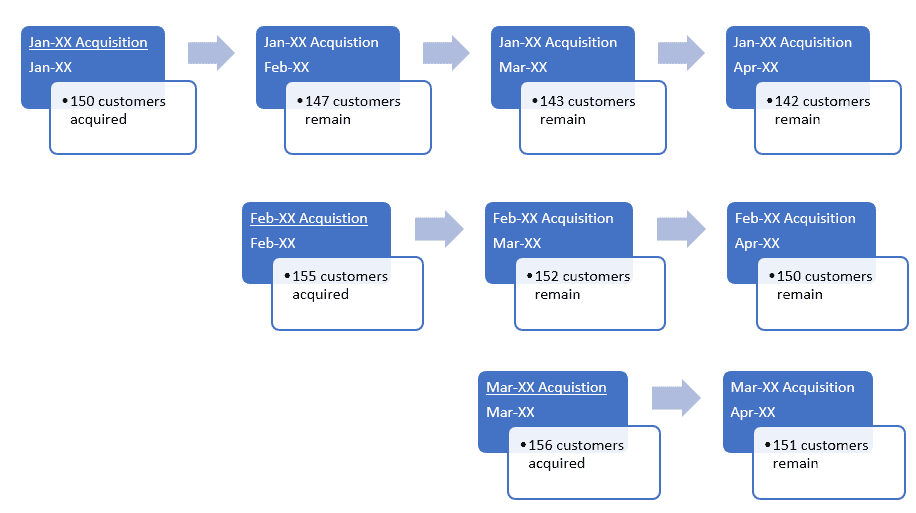
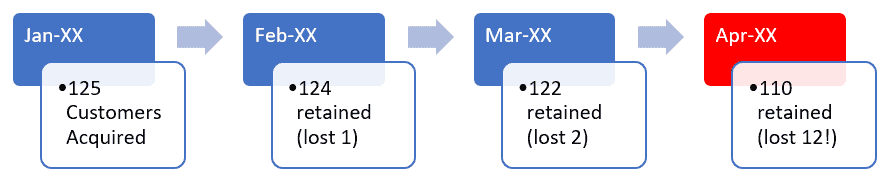
At the most basic level, are they still a customer of ours? With each monthly cohort we can visualize logo retention and any “break points” in the data. Can we recognize a pattern, that, for example, customers begin to churn between months three and four?
This is where Step 5 – Observations from above plays a role. We need to observe and collect the data that will provide meaningful insight into customer retention. We must ask ourselves, for example, how product usage differs between those who churned and those who remain. And what customer touch points did our customer success team, support team or services team have at that time? What role did we play in retention and how can we improve?
To help predict cohort retention, Steve Wolfe, co-founder of Growth Street Partners, introduces a very compelling SaaS metric named the Upsell Rate. He defines the upsell rate as the percentage of customers within a cohort that purchase additional software or services (i.e., the # of customers that purchased more in the cohort divided by the total number of customers in a cohort).
Steve states that the “cohort renewal rate is mostly backward looking and that the upsell rate is predictive. A cohort with a higher upsell rate should have a higher expected renewal rate, as customers who have purchased additional products and services are more likely to renew than those who have not.”
The upsell rate is a useful tool for forecasting future cohort retention so that you can prepare accordingly.
Again, the power of cohort analysis. The point here is to understand as much as possible about your cohorts so that you can formulate questions specific and helpful to your business.
Basic Cohort Analysis – Revenue Retention
In addition to tracking customers counts above, we can take cohort analysis a step further by tracking the total MRR associated with each cohort. By MRR tracking, we want to know if retained customers are expanding or downgrading. Is the customer adding users, modules, and thus more MRR? Or are they downgrading by dropping seats, modules, etc.? And, of course, we track churned customers which removes MRR from the cohort.
And what important SaaS metrics magically appear by tracking total MRR from each cohort? Yes, gross dollar retention (GDR) and net revenue retention (NRR).
Gross Dollar Retention
Gross dollar retention measures the percent of MRR retained after accounting for customer downgrades and churn. This will number will be always be less than 100%. 100% means that you did not churn or downgrade any customers. Gross dollar retention should be presented in your monthly Board or financial pack.
Net Revenue Retention
Net revenue retention measures the percent of MRR retained after accounting for customer expansion, downgrades, and churn. Just like GDR above but the formula adds expansion to the equation. This number can be below or above 100%. We want greater than 100%. Often, when a company has NRR above 100%, you hear this referred to as net negative churn. Again, this retention metric should be tracked in your monthly financial reports.
Predicting the Future with Cohort Analysis
Basic cohort analysis can also provide us with key forecasting assumptions. Kevin Xo, Senior Associate at Growth Street Partners, who works closely with the finance leaders of Growth Street’s portfolio companies, states that
“historical trends can help us confidently predict key MRR drivers such as expansion, contraction, and churn of current and future cohorts.”
For example, if your cohort analysis shows that a typical cohort doubles in size within the first year, you should factor this expansion into next year’s operating model unless there are reasons to suspect that new cohorts will behave differently.
Increased visibility into future recurring revenue allows us to confidently reinvest in sales, marketing, and account management to accelerate future growth.
Cohort Analysis Extended
Ok, we have gone this far with our cohort analysis. Why stop? With just two additional data points, we can extend our cohort analysis to calculate our CAC payback period. To do this, we need to know our customer acquisition costs (CAC) per cohort and our recurring gross margin.
The CAC payback period is another “must-have” metric in your reporting package. The CAC payback period is the number of months it takes to pay back your new customer acquisition costs after accounting for the cost to service those customers.
CAC ties up working capital and can really hurt your company’s liquidity if you have sub-par churn and longer CAC payback periods. I like to compare CAC to debt. It doesn’t just go away if you lose your job (i.e. customer churns).
In my Excel template below, I explain how we implement CAC and recurring gross margin into our cohort analysis.
Ok, we have covered a lot material, but are you ready for the mic drop?

The analyses above are just scratching the surface of cohort analysis. With our subset of customers, we can further bucket our newly acquired customers by additional meta points. This could be acquisition source (paid ads, organic, social media, cold calls, tradeshows), pricing plan, customer demographics, and more.
Segmented Cohort Analysis
In the “basic” cohort analysis above, I describe a cohort as a subset of customers by acquisition month. We can further segment this subset (i.e. customers acquired in Jan-XX) into additional customer-specific characteristics.
This could take the form of external or internal characteristics. I describe external as how the customer was acquired (for example, paid ads or organic website hits) or type of pricing plan, for example. I describe internal as somewhat under the customer’s control; the customer’s usage of our app or their demographics.
Segmented cohort analysis allows us to get much more insight from a specific monthly cohort, because we can explicitly compare the retention of segmented cohorts and act on our observations and analysis.
Segmented Example
I like to use the customer acquisition source as an easy-to-understand example. Let’s say I acquire my customers only through paid ads and inbound organic acquisition. In the charts below, you can see that I further segment my Jan-XX monthly cohort from the example above into two distinct segments, Paid Ads Acquisition and Organic Acquisition.
If I am doing a great job with lead attribution, I could further break down the Paid Ads segment into the specific ad platforms such as LinkedIn, Facebook, Twitter, etc. This would allow me to analyze the best or wort-performing segments from my Paid Ads acquisition channel.
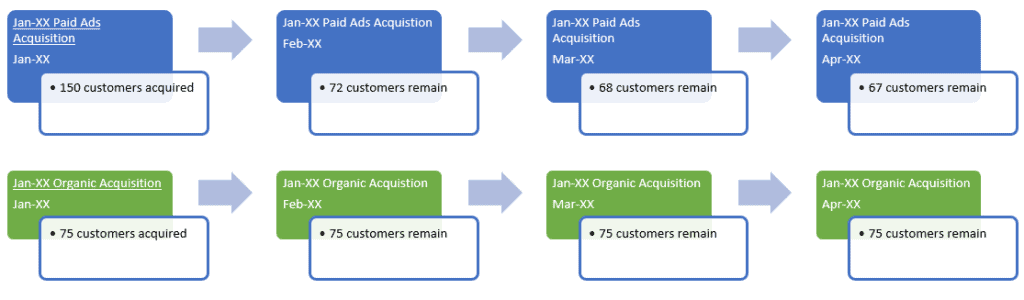
The example is a bit extreme above, but it shows that organic performs much better in customer retention than paid ads.
The Power of Cohort Analysis
You can start to visualize the power of the data that comes from cohort analysis. I’ll be honest. It takes data discipline to track and analyze cohort data. It doesn’t magically appear in your monthly reports.
You must marry initial bookings data, future expansion or downgrades bookings, and churn data. We must track logo counts and dollar counts. If you have an application that tracks all of this for you in simple report, please post a comment below. I and others would love to hear.
Despite the potential of pain of tracking this data monthly, the observations and analysis provides actionable insights into operational strategy. For example, you can invest more heavily in a paid channel that is outperforming other paid channels. Or insert your customer success team into the customer’s journey prior the average month when app usage drops.
Again, the purpose of cohort analysis is to improve customer retention and increased lifetime value.
Download and Thanks
Please download my cohort analysis template below. Do you use cohort analysis in your business? Please post your comments below.
Many thanks to Kevin Xo at Growth Street Partners for reviewing this post and template for accuracy and improvements. And to Steve for his introduction of the Upsell Rate to this analysis.
I have worked in finance and accounting for 25+ years. I’ve been a SaaS CFO for 8+ years and began my career in the FP&A function. I hold an active Tennessee CPA license and earned my undergraduate degree from the University of Colorado at Boulder and MBA from the University of Iowa. I offer coaching, fractional CFO services, and SaaS finance courses.
Thanks for including us. We always enjoy reading your posts and checking out your templates! Team Growth Street
As always a great article! We are currently moving into drawing all of our cohort data from salesforce and build that out into pivot tables. That makes keeping record of all data simpler and it is already married with insightful demographics. In the pivot table format segmentation is made very easy through slicers as well.
Best,
Max
Great post.
Great job explaining the requisite fundamentals here.
Thanks, David!