
Table of Contents

Operating income is essentially the money left over after you deduct all direct and indirect expenses from net revenue. It is one of the many totals that might be shown on the income statement, depending on the level of detail of the income statement.
In this article, we will explain operating income and how it is calculated. We’ll also look at what is and is not included in the calculation, how it differs from other totals, and why it is important. Once you get a handle on these traditional measures of profitability, check out Baremetrics to get your SaaS metrics.
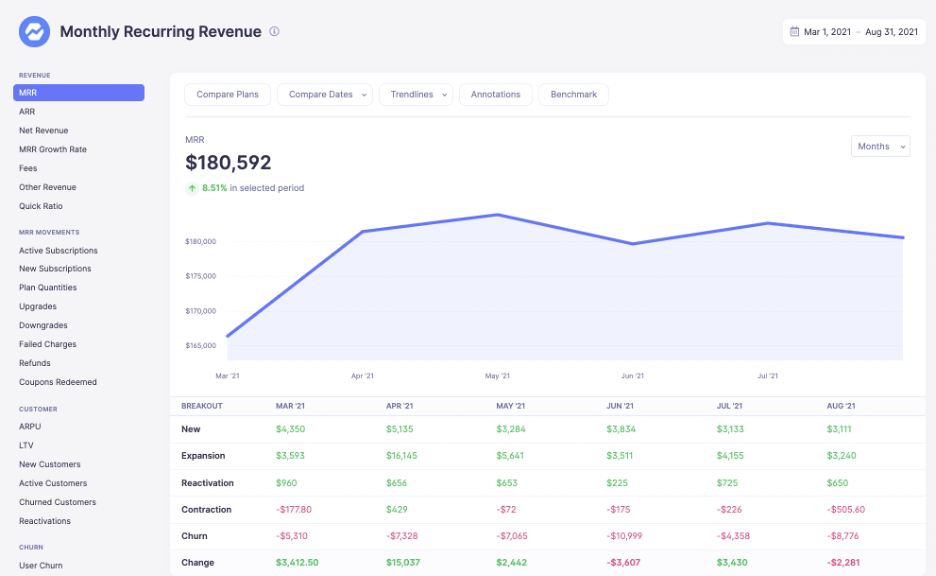
Baremetrics is a business metrics tool that provides 26 metrics about your business, such as MRR, ARR, LTV, total customers, and more. Check out what the MRR graph looks like right here:
Baremetrics integrates directly with your payment gateways, so information about your customers is automatically piped into the Baremetrics dashboards.
You should sign up for the Baremetrics free trial and start monitoring your subscription revenue accurately and easily.
How do you calculate operating income?
Operating income is an official Generally Accepted Accounting Principles (GAAP) measure of a company’s financial health. It has several main components, but it can be summarized as follows:
Operating Income = Gross Profit – Operating Expenses
Gross margin is how much money is left over when you deduct the cost of goods sold (COGS) from net revenue:
Gross Profit = Net Revenue – COGS
Net revenue is how much revenue is left over after you remove returns, refunds, discounts, etc. from revenue:
Net Revenue = Revenue – (Returns + Refunds + Discounts)
So what does all this mean? Operating income is simply the amount of money you have made after all direct and indirect expenses are deducted.
Direct costs are expenses that are directly related to the sale of a product or service. These expenses are usually grouped together as COGS and reported separately from other expenses on the income statement directly following revenue.
Indirect costs are the expenses used to run the larger business operations and therefore usually called operating expenses. These include cash expenses, as such rent, utilities, and payroll, as well as non-operating expenses, namely depreciation and amortization (for tangible and intangible assets, respectively). However, note that operating income does not include taxes or interest, which is why it is often confused with EBIT discussed below.
While there are other ways to calculate operating income, let’s get some definitions down first to make them more understandable.
What are the components of operating income?
Operating income is calculated with three main components. The first is net revenue.
Revenue (or Sales): Revenue is found at the very top of the income statement. It is the sum of all money earned by the company during its core business processes. For a SaaS subscription business, this would include all the money earned from monthly and annual subscriptions that occurred during the period covered by the income statement, as well as add-ons, usage fees, etc.
Net Revenue: From revenue (sometimes called gross revenue) there are certain deductions that are not exactly expenses and come before expenses are listed on the income statement. These deductions include discounts offered to customers or refunds from canceled services or defective products. Once these deductions have been made, the remaining value is the net revenue.
The other two items are the expenses deducted from the net revenue: COGS and operating expenses.
Cost of Goods Sold (COGS): COGS commonly follows the revenue on the income statement. Net revenue minus COGS is gross margin. COGS is the total cost of a company’s products or services, and it is also referred to as the cost incurred to manufacture goods or services. COGS only includes the direct costs of producing your service.
Operating Expenses: These are the expenses generated by a company’s core business activities. Operating expenses include payroll, utilities, rent, pension contributions, and sales commission.
Since we are going compare operating income to a couple other measures of a company’s profitability below, let’s add a few more definitions here:
Depreciation: Depreciation is a method for spreading the cost of a long-term tangible asset over its useful life. Depreciable assets can include buildings, equipment, office furniture, vehicles, land, and machinery. Note that which assets can be depreciated depends on local tax codes.
Amortization: Amortization is a system for spreading the cost of an intangible asset over the course of its useful life. Amortizable assets can include patents and trademarks, franchise agreements, proprietary processes, and the cost of issuing bonds to raise capital.
Taxes: Taxes are calculated based on a business’s revenue less all tax-deductible expenses.
Interest: The interest expense is the amount of money spent to service a loan. Conversely, a company may receive interest on the money they have in the bank.
Gains: Gains are the results of positive financial events not related to the company’s core activities. Gains indicate the amount of money gained by the company from one-off events. They can include the sale of an operating segment. For example, Baremetrics recently sold Intros for $100,000. Gains can also come from selling off unproductive assets or assets that have reached the end of their useful life such as old vehicles, unused land, etc.
Losses: Losses are the results of negative financial events not related to the company’s core activities. Losses indicate the amount of money the company lost from such one-off events as settlement of a lawsuit or a loss due to a stock trade.
With these further definitions down, we can now compare operating income to several other totals you might find on the income statement. However, for a SaaS business, this is only the start of your financial analysis.
Baremetrics provides an easy-to-read dashboard that gives you all the key metrics for your business, including MRR, ARR, LTV, total customers, and more directly on your Baremetrics dashboard. Just check out this demo account here.
Connect Baremetrics to your revenue sources and start seeing all of your revenue in a crystal-clear dashboard. You can even see your customer segmentation, deeper insights about who your customers are, forecast into the future, and use automated tools to recover failed payments.
Sign up for the Baremetrics free trial and start seeing more into your subscription revenues now.
What are the other measures of a company’s profitability?
Gross Profit: Gross profit is simply net revenue minus COGS.
Gross Profit = Net Revenue – COGS
Gross Profit Margin: Gross profit margin is the gross profit turned into a ratio or percentage.
Gross Profit Margin = (Net Sales – COGS)/Net Sales
Note that, to show this as a percentage, as is common, you can multiply the ratio by 100.
EBIT (or Operating Earnings): This is a non-GAAP measure of a company’s financial performance. It tells you how much the company has made before subtracting interest and taxes. It differs from operating income because it includes all the gains and losses, i.e., non-operating profit and expenses, respectively, as well.
EBIT = Net income + Interest + Taxes
To see the difference more clearly, look at this comparison equation:
Operating income = Operating Revenue – Operating Expenses = EBIT – Non-Operating Profit + Non-Operating Expenses
EBITDA: This is another non-GAAP measure of profitability. In addition to not including interest and taxes, EBITDA subtracts non-cash expenses, i.e., depreciation and amortization, as well. This can give you an idea of the true profitability of the period since depreciation and amortization are accounting expenses only.
EBITDA = Net income – (Interest + Taxes + Depreciation + Amortization)
As a comparison, we can look at how EBIT and EBITDA relate to each other:
EBIT = Net income + Interest + Taxes = EBITDA – (Depreciation + Amortization)
Net Income: Net profit (or loss) is the amount of money your company finally earned (or lost). It comes at the very bottom of the income statement and is net of everything including COGS, gains and losses, cash and non-cash expenses, interest on your loans, and taxes.
Net Income = (Net Revenue + Gains) – (Expenses + Losses)
All of these different measures are important. They tell you different things about your company, but they are also used by all the outside business people you deal with while building, running, and expanding your company. Accountants, auditors, potential investors, bankers, tax authorities, etc. will be interested in some or all of these measures when assessing the health of your business, how much you owe in taxes, your creditworthiness, or how to evaluate the value of your company for an investment.
Operating income example
Let’s see if we can calculate all of these different measures based on the information in the table below (following conventions, the negative numbers are in brackets for clarity):
|
Item |
Value |
Item |
Value |
|
Revenue |
20,000 |
Amortization |
(300) |
|
Returns, Refunds, and Discounts |
(1,000) |
Interest Paid |
(500) |
|
Costs of Goods Sold |
(4,000) |
Taxes |
(3,000) |
|
Rent |
(1,000) |
Sale of Platform |
10,000 |
|
Payroll |
(2,000) |
Settlement of Lawsuit |
(5,000) |
|
Depreciation |
(1,000) |
Let’s start from the top with net revenue. We can see that revenue is $20,000 and the returns, refunds, and discounts total $1,000. That gives us a net revenue of $19,000.
With the COGS of $4,000, we can get a gross profit of $15,000. As a percentage, this leaves us with a very robust gross profit margin of approximately 79%.
Next, we need to total up all the expenses (excluding interest and taxes) to get the total indirect expenses of $4,300. Subtracting this value from the gross profit gives us and operating income of $10,700.
Adding in the gains and losses, shown as the sale of a platform and settlement of a lawsuit, respectively, we can get an EBIT of $15,700.
If we then remove the depreciation and amortization, we are left with an EBITDA of $17,000.
Finally, we can sum up everything to get a net income of $12,200.
In a SaaS business, these measures are not enough. There are many other metrics that need to be tracked.
Baremetrics brings you metrics, dunning, engagement tools, and customer insights. Some of the things Baremetrics monitors are MRR, ARR, LTV, the total number of customers, total expenses, quick ratio, and more.