5 minute read / Jan 15, 2015 /
Benchmarking Xero's S-1 - How 7 Key SaaS Metrics Stack Up
This post is part of a continuing series evaluating the S-1s of publicly traded SaaS companies in order to better understand the core business and build a library of benchmarks that might be useful to founders.
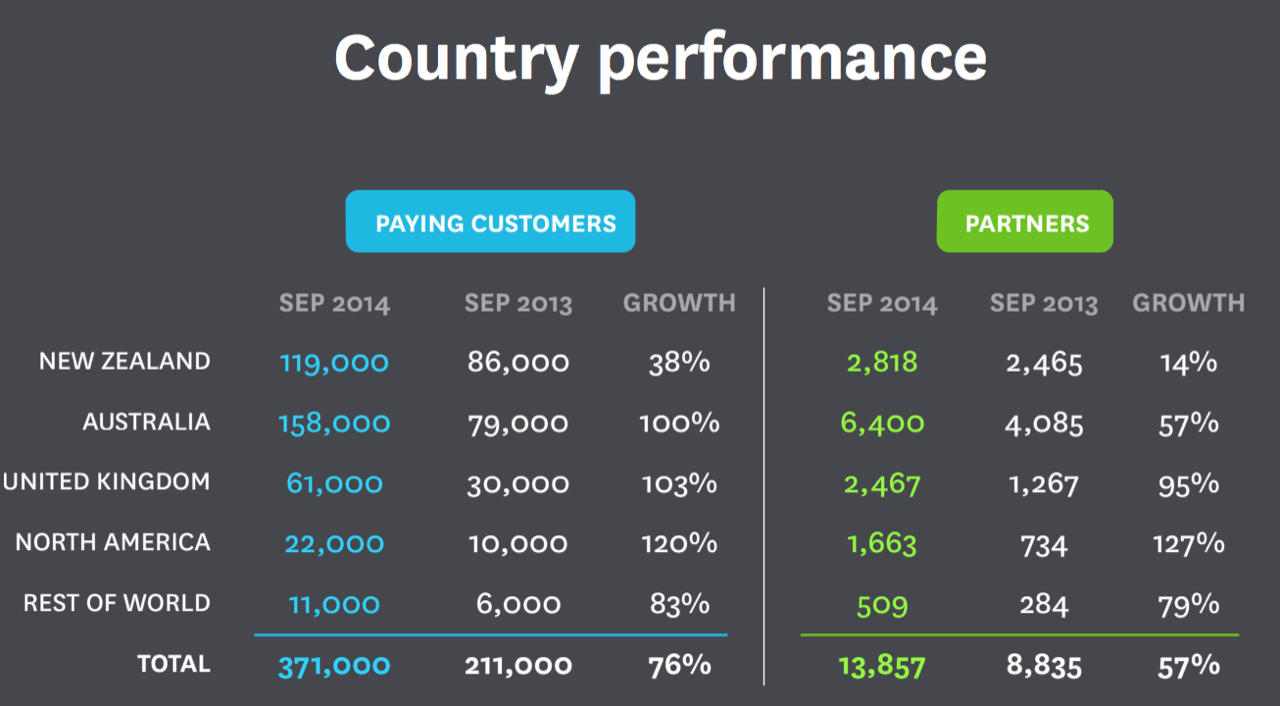
There’s a SaaS company on the other side of the world founded nine years ago that is worth $2B, generates $100M in annual revenue and growing 80% year over year. Based in New Zealand, Xero has built a widely adopted small-to-medium business (SMB) accounting solution that counts 371,000 paying customers, a figure that grew 76% in the last 12 months. Amazingly, 30% of New Zealand GDP is processed by Xero.
Xero is an unusual company for two reasons. First, Xero is a glowing example of a successful SMB SaaS company. Second, Xero became a publicly traded company on the New Zealand exchange very, very early on. Consequently, nearly all of the company’s data is public. In fact, below I’ve copied Xero’s P&L from its first year since founding all the way through 2014 - a data set I never thought I would be able to publish on any company for confidentiality reasons.
| Xero Income Statement | 2007 | 2008 | 2009 | 2010 | 211 | 2012 | 2013 | 2014 |
|---|---|---|---|---|---|---|---|---|
| Revenue | 0.01 | 0.306 | 0.6 | 2.3 | 7.1 | 15.8 | 32.9 | 61.9 |
| Growth | 109% | 265% | 206% | 123% | 107% | 88% | ||
| Gross Profit | -0.8 | -2.0 | -2.3 | -3.5 | -1.6 | 0.3 | 21.2 | 40.6 |
| SG&A. | - | 0.3 | 1.2 | 2.2 | 3.3 | 6.2 | 25.1 | 58.6 |
| R & D Exp. | - | - | - | - | - | - | 9.7 | 16.0 |
| Net Income | -1.0 | -3.4 | -3.9 | -6.0 | -5.7 | -6.5 | -12.1 | -30.8 |
| % of Revenue | -611% | -257% | -80% | -41% | -37% | -50% |
You can read through Xero’s investor materials on their investor portal and sift through their annual report for 2015 here, which reveals that the company acquires SMBs by convincing outsourced accountancies migrate the SMBs these accountancies serve to Xero. And in the US, each accountancy provides about 13 SMB customers to Xero.
In the next few charts, we’ll explore Xero’s business and compare it to a basket of publicly traded SaaS companies.
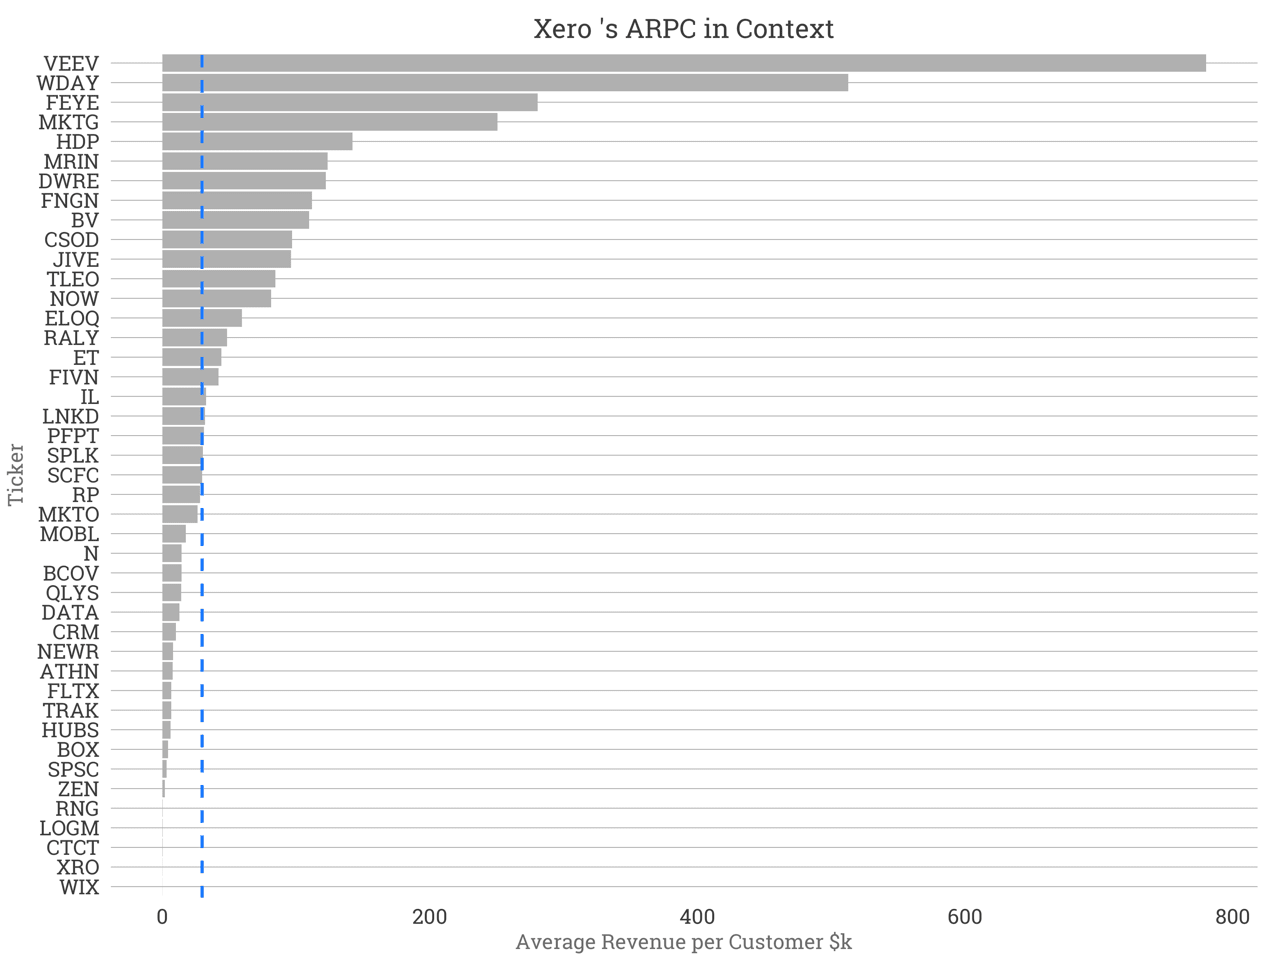
Xero operates at the lowest end of the SMB market and its Average Revenue per Customer is second-smallest in this data set at $167 per year. In fact, the ARPC is so small, you can barely see it on the chart. Only WIX, a website builder, has a smaller ARPC.
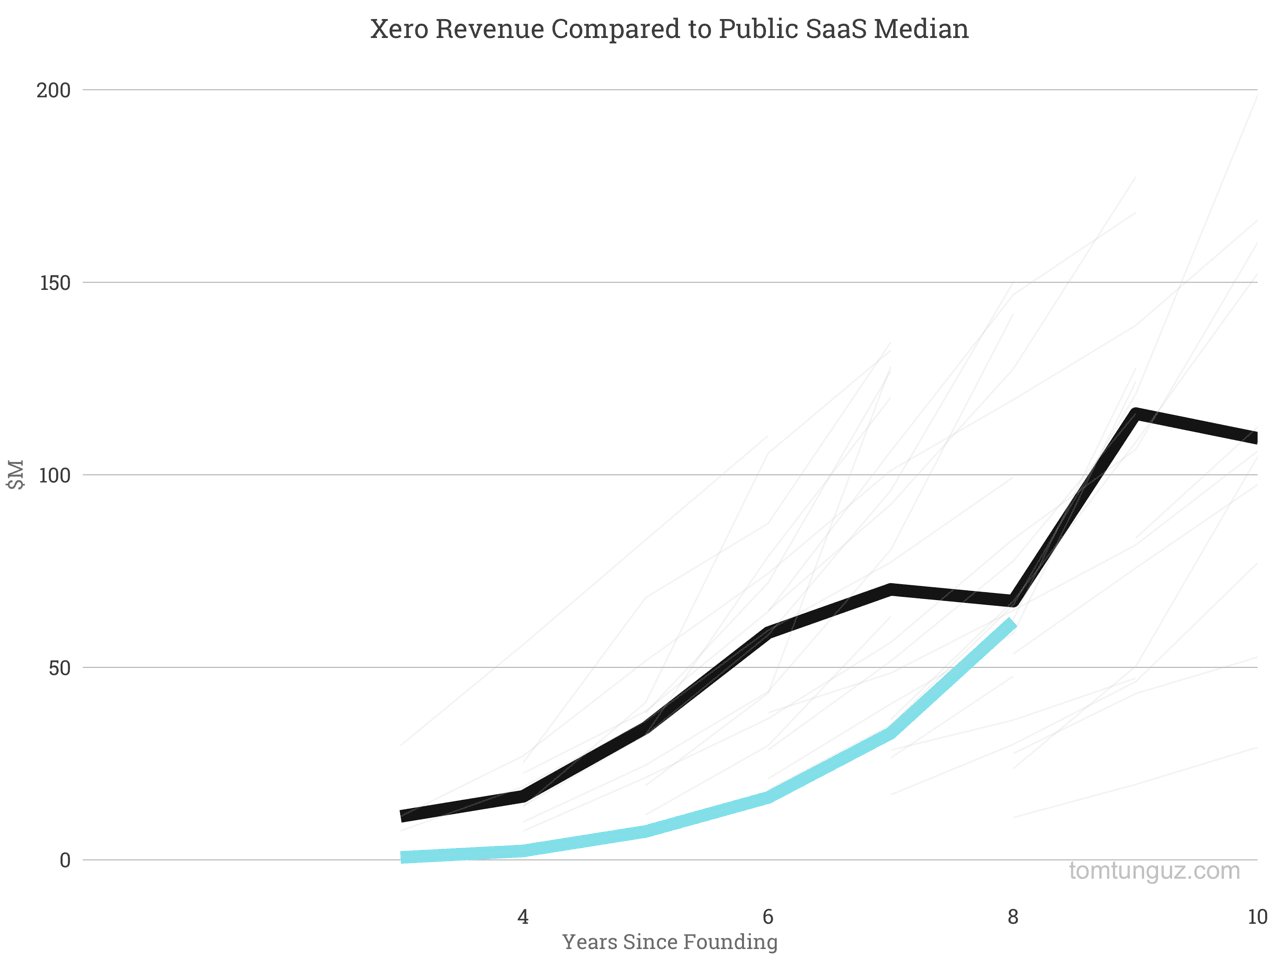
Nevertheless, Xero has built a fast growing business. The company reached $62M in revenue in year 7. It has taken Xero a bit longer to reach these revenue milestones than the typical company. This may be because the business started initially in New Zealand, expanded to Australia, then the US & the UK, unlike the majority of the others in the data set which started in the US, and didn’t face cross-border market expansion until later in their growth.
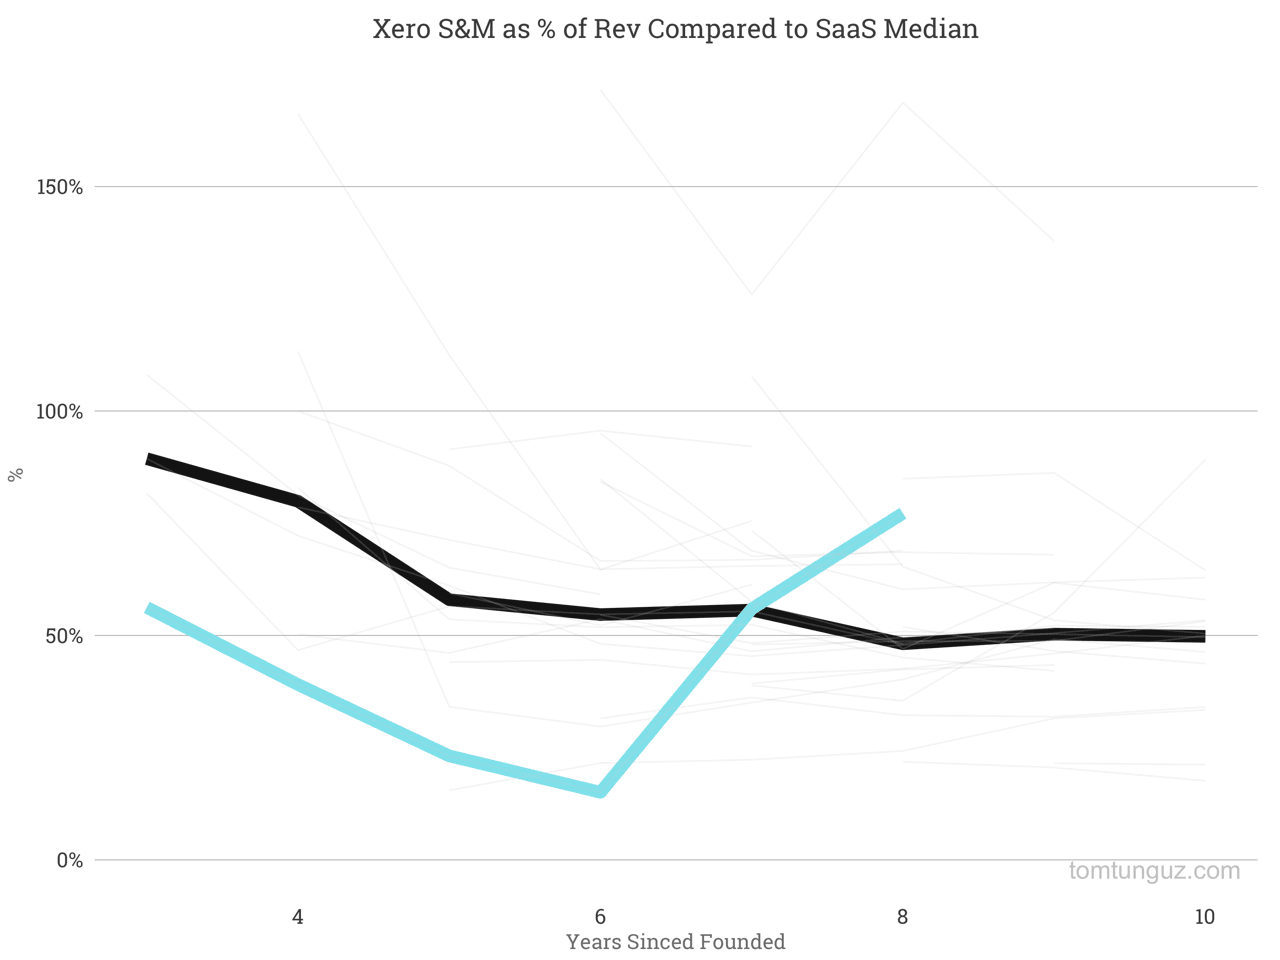
Historically, Xero has spent far less than the median in Sales & Marketing, likely because they achieved high growth rates through dominance of the accountancies in New Zealand and Australia very quickly. Xero expanded into the US in 2011, which is year five in the chart above. Not coincidentally, the company has invested much more aggressively in sales and marketing at and after the US launch to displace Xero’s biggest competitor in the US, Intuit’s Quickbooks.
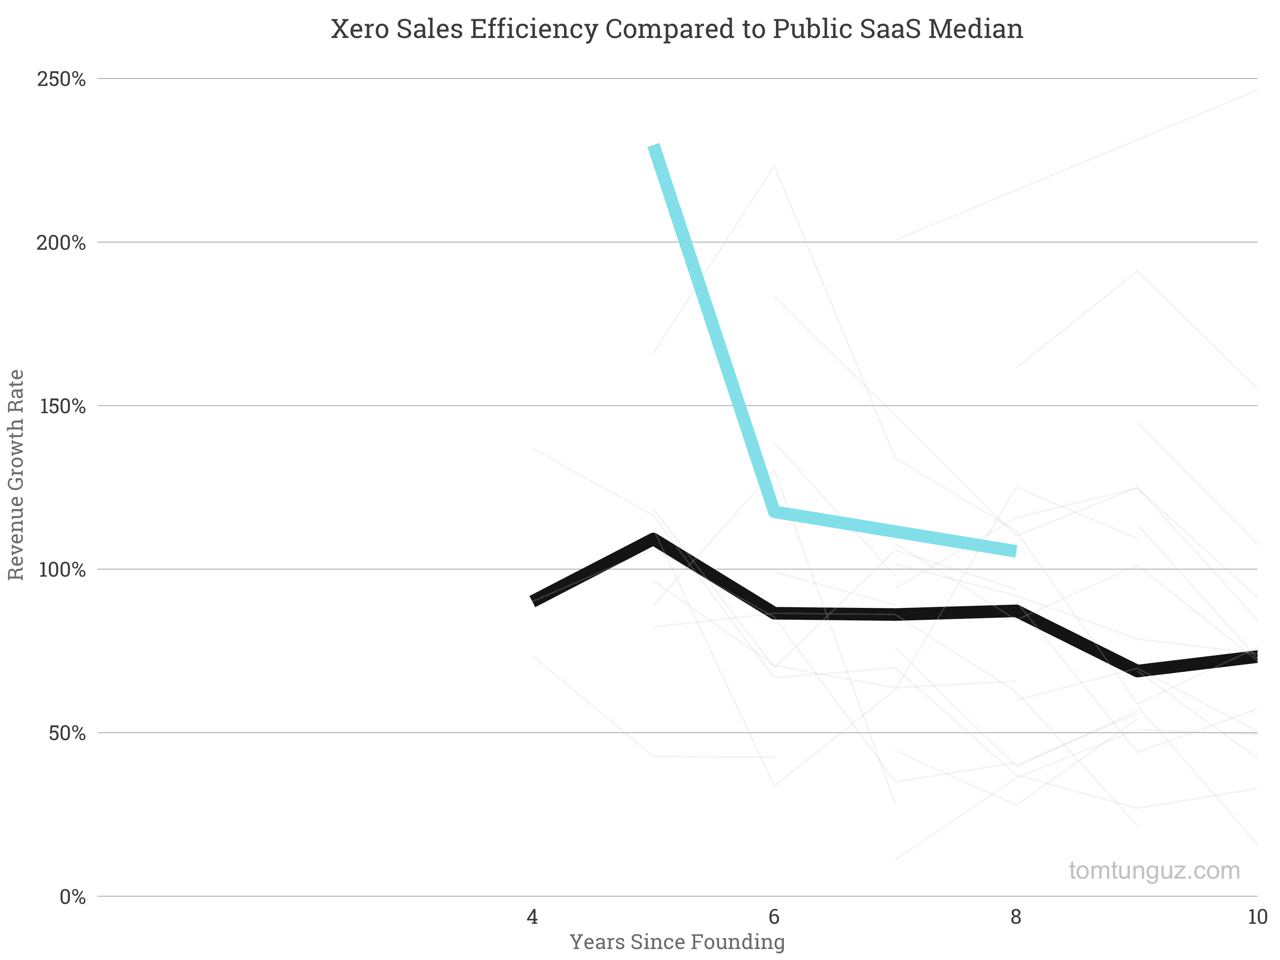
Xero does exhibit an amazing sales efficiency metric of 1.05, meaning $1 invested today in sales and marketing yields $1.05 in gropss profit next year. The median SaaS company charts 0.81 sales efficiency, meaning Xero is at least 50% more efficient. Xero’s efficiency is driven by its customer acquisition strategy, winning accountants and encouraging them to migrate all their business from a competitor to Xero. Winning one accountant generates more than 13 end customers, and generates substantial leverage in the sales model.
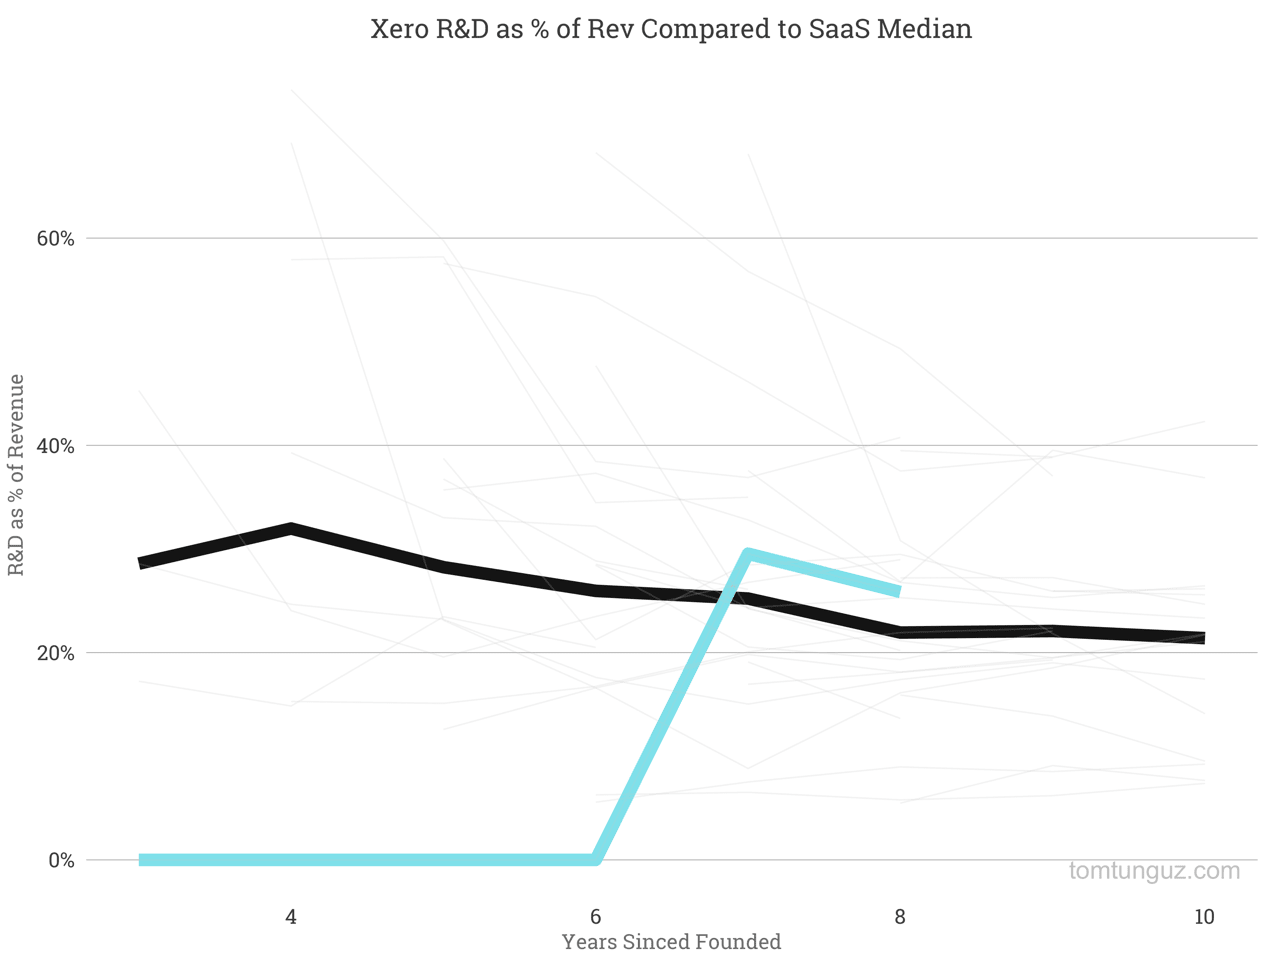
Xero didn’t break out its engineering spending in its financials until 2013. Of late, the company has been spending about 40% of its revenue on research and development, more than 10 points above the median, to build out its product suite. Most notably, Xero launched a payroll product in the US in early 2015.
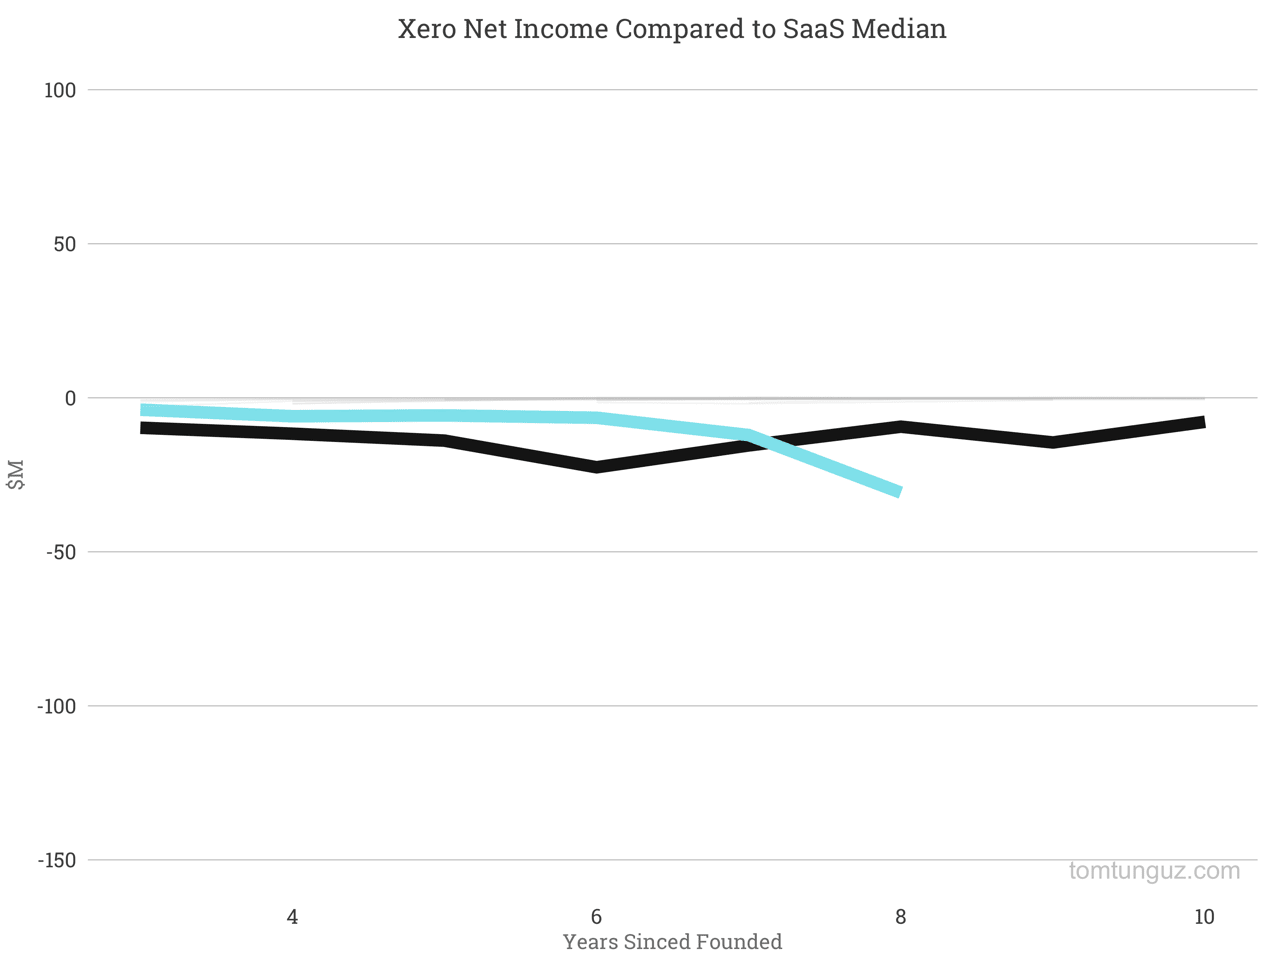
In dollar terms, Xero’s net income mirrors the median. The company burned about $30M on revenues of $62M.
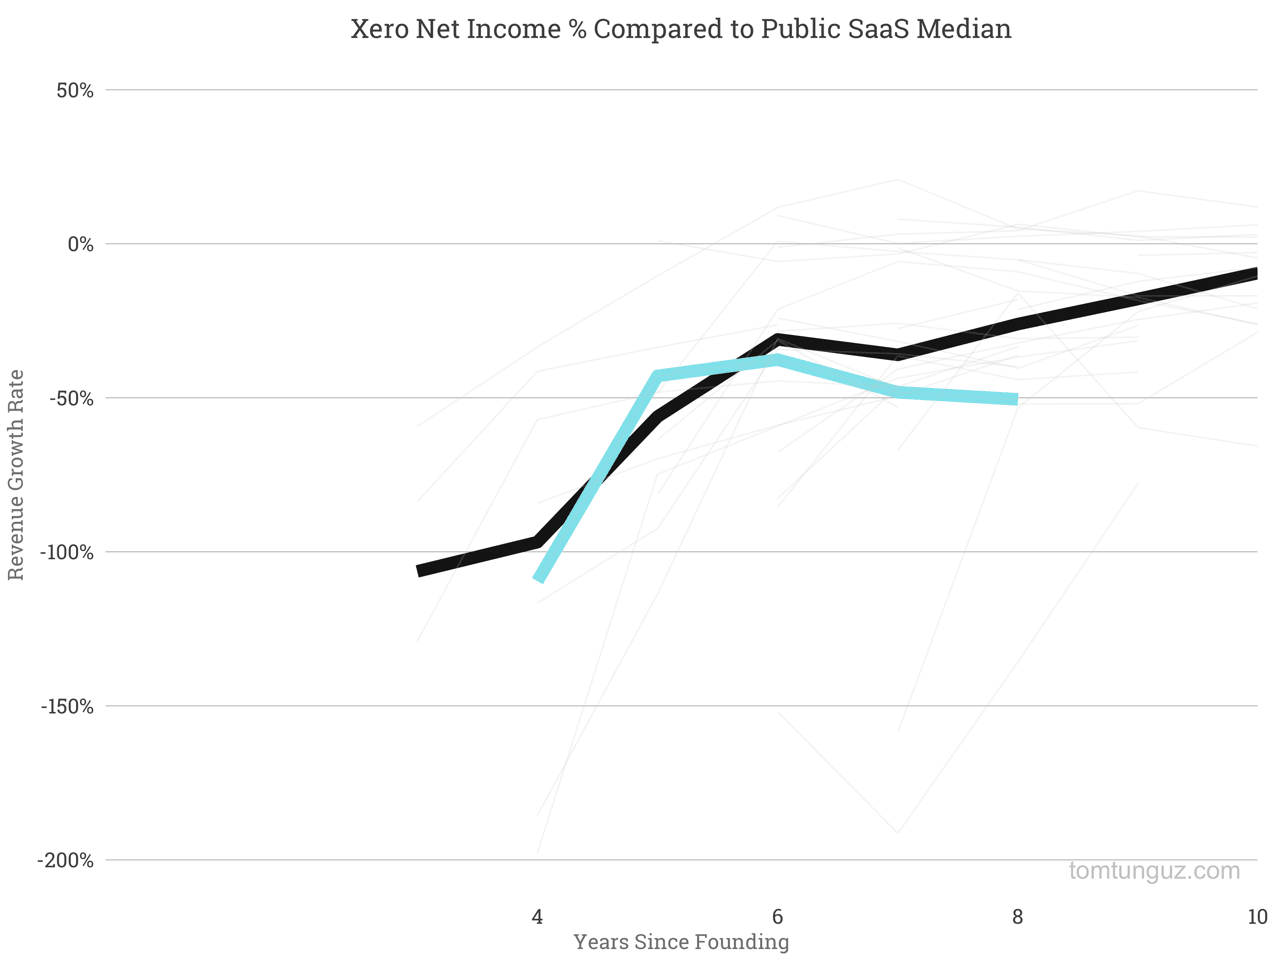
In percentage terms, the story is similar. Xero is right at the median, burning about 10 points more than the median, 48% of revenue, compared to 37 points.
Xero is an amazing SMB SaaS business to study because of the company’s ability to develop a monopoly in two smaller markets before expanding to the US, which is rare. It’s much more common to see a US company move abroad. In addition, Xero has employed a unique go-to-market through accountancies that generates enormous efficiencies for its sales and marketing teams. Last, much of Xero’s data from the very earliest days of the company are public, meaning Xero can serve as a great benchmark for other startups.
A few quick things to note when examining Xero’s business. The filings are denominated in New Zealand dollars, so be sure to convert to USD. Also, Xero never filed an S-1 because the S-1 is a US exchange requirement and Xero trades in New Zealand, but there are equivalent documents on Xero’s investor site. Last, Xero has a negative gross margin for its early years, which is unusual. This is because they put the majority of their operating expenses in their Cost of Goods Sold. I suspect it might be a regional accounting difference. If there are accountants reading, I’d appreciate your insight.